



Real estate market analytics sounds technical, but at its core it is simply the practice of using data to make better property decisions. That can mean analyzing rents before a lease renewal, tracking vacancy before launching a marketing campaign, or comparing neighborhoods before buying an asset. It also means looking beyond headline market news and understanding what specific numbers are saying about a property, a building type, or a local submarket. For everyday owners and managers, this is less about abstract forecasting and more about reducing guesswork.
Table Of Content
- What Real Estate Market Analytics Actually Means
- Why Analytics Matters Beyond Investment
- The Core Metrics Every Reader Should Understand
- Vacancy Rate
- Occupancy
- Rent Growth
- Turnover Rent
- Absorption Rate and Lease Up Pace
- Days on Market and Months of Inventory
- NOI and Operating Expense Ratio
- Cap Rate
- Affordability Measures
- How to Read Metrics Together Instead of Separately
- Using Analytics for Everyday Property Management
- Setting and Adjusting Rents
- Reducing Vacancy and Improving Marketing
- Budgeting and Capital Planning
- Retention and Renewal Strategy
- Why Local and Submarket Data Matters More Than Headlines
- AI and Automation in Real Estate Analytics
- Common Misconceptions That Distort Real Estate Analysis
- A Practical Workflow for Turning Data Into Decisions
- Step 1: Define the Decision
- Step 2: Pull the Relevant Data
- Step 3: Segment the Market
- Step 4: Compare Trend Direction
- Step 5: Choose an Operational Response
- Useful Data Sources and Tools
- What Good Market Analytics Looks Like in Practice
- Final Thoughts
Too often, market analytics is framed only as an investor tool. That misses the broader value. A landlord deciding whether to offer one month free rent, a building manager choosing which units to renovate first, and an owner planning next year’s maintenance budget are all making analytics driven decisions, whether they call them that or not. The difference between reactive management and strategic management is usually the quality of the data behind the decision.
Recent market conditions make this even more important. In Canada, CMHC reported that the purpose built rental vacancy rate rose to 3.1 percent in 2025, up from 2.2 percent in 2024, a reminder that rental markets can loosen quickly when supply increases and demand slows. In the United States, the National Association of Realtors reported 4.09 million existing home sales in June 2026, a median sales price of $440,600, and 4.6 months of inventory. Those figures are not just news points. They are signals about pricing power, affordability pressure, competition, and changing demand behavior.
This guide explains the fundamentals of real estate market analytics in practical terms. You will learn the metrics that matter, how to interpret them together rather than in isolation, how analytics supports property management as much as investment, and where new tools such as AI fit into the workflow. The goal is simple: turn raw housing data into clearer everyday decisions.

What Real Estate Market Analytics Actually Means
Real estate market analytics is the structured use of property, demographic, economic, and transactional data to understand how a market is performing and where it may be heading. It helps answer questions such as whether rents are rising faster than incomes, whether inventory is building up, whether a neighborhood is absorbing new supply, and whether a property’s operating performance is improving or slipping. It connects local market conditions to operational choices inside a building or portfolio.
For investors, analytics often begins with acquisition and valuation. They want to know if an asset is fairly priced, what cap rate is reasonable, and what future income growth might look like. For property managers, the priorities are often more immediate. They need to know how fast vacant units are leasing, whether a rent increase is realistic, where concessions are becoming common, which unit types underperform, and how maintenance costs are affecting net operating income.
The most useful way to think about analytics is as an intelligence layer. The market produces signals every day through listings, leases, sales, vacancy changes, construction pipelines, demographic shifts, mortgage costs, and tenant behavior. Analytics organizes those signals into patterns people can act on. Without that layer, decisions rely too heavily on instinct, delayed reports, or broad averages that may not reflect a property’s real competitive environment.
This is also why the phrase the market can be misleading. There is no single market. Office, multifamily, industrial, retail, and data center sectors behave differently. Even within one city, downtown Class A apartments, suburban workforce housing, and student oriented rentals may follow different pricing and vacancy trends. Good analytics starts by narrowing the market definition until it becomes relevant to the property in question.
Why Analytics Matters Beyond Investment
When people hear market analytics, they often picture an investor deciding whether to buy or sell. In reality, some of the most valuable uses happen after a property is already owned. Day to day management creates hundreds of decisions that benefit from better data, from lease pricing and renewal timing to contractor scheduling and reserve planning. The financial outcome of these operational choices can be as important as the original purchase price.
Consider rent setting. If a property manager only looks at citywide average rent growth, they may overprice units in a softening submarket or underprice renovated units in a stronger micro location. A more analytical approach compares asking rents, achieved rents, concessions, turnover rents, vacancy by unit type, and nearby competitive inventory. That creates a more realistic view of what tenants will actually pay. In a market where incentives are increasing, the effective rent may matter more than the headline rent.
Maintenance and capital planning also improve with analytics. If two bedroom units experience the highest turnover and most maintenance requests, that pattern may suggest an opportunity to prioritize targeted upgrades or preventative repairs. If utility expenses are rising faster than rent growth, the owner may need to shift capital toward efficiency improvements rather than cosmetic renovations. This is where analytics becomes operational intelligence rather than market trivia.
Tenant retention is another example. A building with decent occupancy but poor renewal rates may be masking future revenue risk. Watching renewal performance, delinquencies, concession dependence, complaint patterns, and local competitor pricing can reveal whether a property is retaining tenants because it is genuinely competitive or simply because moving costs are temporarily high. The difference matters when conditions change.
Real estate analytics is most powerful when it helps answer small recurring questions with large financial consequences. Should we raise rents now, offer a concession, renovate this unit, delay that capital project, or change our leasing strategy?
The Core Metrics Every Reader Should Understand
The foundation of market analytics is not glamorous. It is a small set of recurring metrics that, when read together, explain most market conditions. Understanding them clearly is more useful than chasing complicated models too early. The challenge is not memorizing definitions. It is learning how each metric changes the meaning of the others.
Vacancy Rate
Vacancy rate measures the share of units or space that is unoccupied and available for lease. It is one of the fastest ways to understand the balance between supply and demand. Rising vacancy generally suggests loosening conditions, weaker pricing power, or recently delivered supply that has not yet been absorbed. Falling vacancy often indicates tighter conditions and stronger landlord leverage.
But vacancy rate needs context. A low vacancy rate does not automatically mean strong property performance. A building can have low vacancy and still underperform if rents are below market, arrears are high, turnover is expensive, or maintenance costs are eroding profitability. Vacancy tells you something important, but never the whole story.
Occupancy
Occupancy is closely related to vacancy, but managers often track it as a property level operating metric rather than a market statistic. Economic occupancy can differ from physical occupancy if units are occupied but revenue is discounted by concessions, delinquency, or non paying tenants. That distinction is critical. A building that looks full on paper may still be underperforming financially.
Rent Growth
Rent growth measures how rents are changing over time. Analysts usually track asking rent growth, achieved rent growth, and renewal growth separately because each tells a different story. Asking rents show market positioning, achieved rents reflect actual execution, and renewal growth indicates how much pricing power exists with existing tenants. Average rent growth can be informative, but it can also hide softness in specific unit types or quality tiers.
Turnover Rent
Turnover rent refers to the rent achieved when a new tenant replaces a previous one. This matters because it reveals the difference between in place rents and current market rents. CMHC’s rental reporting has made this concept especially useful in Canada because it highlights how new lease pricing can diverge from average in place rents. If turnover rents are flattening while average rents still look healthy, the market may be weakening faster than headline numbers suggest.
Absorption Rate and Lease Up Pace
Absorption measures how quickly available units or space are being taken up by the market. In development and multifamily analysis, lease up pace helps show whether new supply is being digested efficiently. Strong absorption can offset rising supply. Weak absorption signals that deliveries may be outpacing demand, which often leads to incentives, slower rent growth, or both.
Days on Market and Months of Inventory
In for sale housing, days on market tracks how long listings remain active before going under contract or selling. Months of inventory estimates how long it would take to sell current inventory at the present sales pace. The NAR June 2026 snapshot of 4.6 months of inventory is a good example of a number that sits between tight and more balanced conditions. Read alongside sales pace and median price, it helps explain whether buyers or sellers have the stronger position.
NOI and Operating Expense Ratio
Net operating income, or NOI, is a central measure of income producing property performance. It is calculated by subtracting operating expenses from gross operating income, before debt service and taxes. Property managers should care deeply about NOI because it connects daily operations to long term value. Rent collection, renewals, vacancy loss, maintenance efficiency, and utility control all flow into this number.
The operating expense ratio adds another layer by showing how much of income is consumed by expenses. Rising revenue can still produce disappointing outcomes if expenses rise faster. This is one reason analytics needs to link market data with internal property data. Market strength alone does not guarantee strong performance.
Cap Rate
Cap rate expresses a property’s NOI as a percentage of its value or purchase price. It is widely used in valuation because it offers a quick way to compare income returns across assets. Yet it is one of the most misunderstood metrics in real estate. A cap rate is not a complete measure of quality, risk, or growth. Two properties with the same cap rate may have very different tenant risk, capital needs, lease rollover exposure, and expense structures.
Affordability Measures
Affordability metrics connect the housing market to real household budgets. They include rent to income ratios, mortgage payment burdens, and broader affordability indices. The U.S. Federal Reserve’s 2025 housing survey found that the median monthly mortgage payment among homeowners with a mortgage rose to $1,600, up from $1,500 in 2024. That shift matters because financing costs influence whether households rent longer, delay buying, or move to lower cost submarkets.
How to Read Metrics Together Instead of Separately
The most common analytics mistake is treating one metric as the answer. Markets do not work that way. A rising vacancy rate may look negative, but if absorption is strong and a major supply wave is about to end, the softness may be temporary. Strong rent growth may look attractive, but if it is driven mostly by turnover rather than broad tenant affordability, it may not be sustainable. Good analysis is relational. It looks for patterns across metrics.
Imagine a multifamily property in a city where vacancy is rising but only in higher rent quartiles. At the same time, lower quartile units remain tight, and concessions are appearing mostly in newly delivered buildings. That tells a different story than a simple headline that says vacancy is increasing. It suggests segmentation by product quality and price point. For a mid market property manager, the right decision may be to hold rents steady rather than discount aggressively.
Now consider a for sale market with stable prices but rising months of inventory and longer days on market. If sales pace is slowing while inventory builds, price resilience may be temporary. A homeowner planning a sale, or an investor tracking condo exit values, should not focus only on the current median price. Liquidity matters. Time to transact matters. A market can look healthy on price while becoming less favorable underneath.
This is why benchmark data from sources like CMHC and NAR is useful, but only as a starting point. The goal is to compare your property or target neighborhood against a relevant slice of the market. National averages are educational. Submarket analytics is actionable.
Using Analytics for Everyday Property Management
The practical value of market analytics becomes clearest in property operations. Most owners are not making acquisition decisions every month, but they are constantly making management decisions. Those decisions affect revenue stability, tenant satisfaction, maintenance burden, and ultimately asset value. Analytics helps connect operating choices to real market signals.
Setting and Adjusting Rents
Rent setting should combine internal leasing results with external market benchmarks. Managers should compare current in place rents, renewal offers, achieved rents on new leases, and competitor effective rents after concessions. In a softening environment, headline rents may hold while incentives increase, which means effective rent is falling. CMHC noted that landlords in some Canadian markets increasingly offered incentives such as free rent or moving allowances as conditions loosened. If you ignore concessions, you may misread the true state of competition.
Segmented data improves pricing decisions further. CMHC data includes vacancy by rent quartile and percentile rents across urban centres, which allows owners to position units more accurately within a market. That matters because a unit competing in the upper quartile should not be benchmarked the same way as one targeting budget conscious renters. Analytics becomes more useful as it becomes more specific.
Reducing Vacancy and Improving Marketing
If vacancy is rising, the first instinct is often to cut rent. That may work, but it is not always the best or only response. Analytics may show that leasing delays are concentrated in certain floor plans, exposure channels, or move in periods. It may reveal that unit condition, outdated photos, poor response times, or weak renewal conversion are bigger issues than pricing alone. Smart managers separate demand weakness from process weakness.
Marketing analytics can show which listing platforms generate tours, which campaigns convert most efficiently, and how lease up pace varies by season. If one bedroom units lease quickly but two bedroom units stall, the issue may be family demand, layout competitiveness, or price relative to ownership alternatives. The solution could be revised messaging, bundled parking, or modest upgrades rather than broad based rent reductions.
Budgeting and Capital Planning
Capital planning benefits from both market and property level analytics. If market data shows renters are increasingly price sensitive while your building’s repair costs are rising, you may need to focus on durable improvements with clear operating savings. If higher quality competitors are achieving premium turnover rents, there may be a case for selective renovations. The point is not to spend more. It is to spend with clearer expected outcomes.
Historical maintenance data also matters. Repeated service issues in the same unit type or building section often signal the need for a proactive capital intervention. Analytics helps identify whether the problem is isolated or systemic. This improves forecasting and reduces the hidden cost of recurring reactive repairs, which often show up in both budget overruns and tenant dissatisfaction.
Retention and Renewal Strategy
Renewal strategy should not rely on a single market rent estimate. Managers need to evaluate resident satisfaction, delinquency risk, local concession trends, comparable asking rents, and turnover cost. Sometimes a modest renewal increase produces a better NOI outcome than pushing aggressively for market rent and risking vacancy plus make ready expenses. Analytics makes that trade off visible.
Retention analysis is especially important in markets where affordability is strained. Households under pressure may be more sensitive to rent increases, utility costs, and commuting trade offs. Watching renewal acceptance by income segment, unit size, or move in cohort can reveal patterns that broad occupancy numbers miss. This allows for more nuanced renewal offers and service planning.

Why Local and Submarket Data Matters More Than Headlines
One of the biggest misconceptions in real estate is that national or even metro level averages are enough for decision making. They rarely are. Housing markets are intensely local. A city can show modest rent growth overall while one neighborhood softens sharply because of new supply, and another remains tight because zoning limits construction. Broad averages smooth out the exact differences that operators need to see.
Submarket analysis means narrowing the lens to a more relevant competitive set. That can include neighborhood, transit access, school district, building age, unit quality, renter income band, or tenure type. For instance, CMHC’s city level data becomes much more useful when paired with quartile level rents and vacancy segmentation. It allows a manager to ask not only what is happening in the city, but what is happening in the part of the market that resembles their asset.
The same principle applies across asset classes. CBRE projected U.S. office vacancy could peak around 19 percent in 2025, while multifamily vacancy was expected to decline to 4.9 percent and rents to rise 2.6 percent. NAIOP’s first quarter 2026 industrial forecast said U.S. industrial vacancy reached 6.9 percent after deliveries exceeded absorption in 2025. These are very different stories. Anyone speaking about real estate as if it were one unified market is leaving out the most important part.
AI and Automation in Real Estate Analytics
AI is changing the speed and accessibility of real estate analytics, though not in the simplistic way people sometimes imagine. The best use cases today are often operational. JLL’s 2025 research notes that AI adoption in real estate is increasingly being used for automating routine property management tasks, tenant communication, and document summarization. That may sound modest, but it matters because it frees teams to spend more time on higher value analysis.
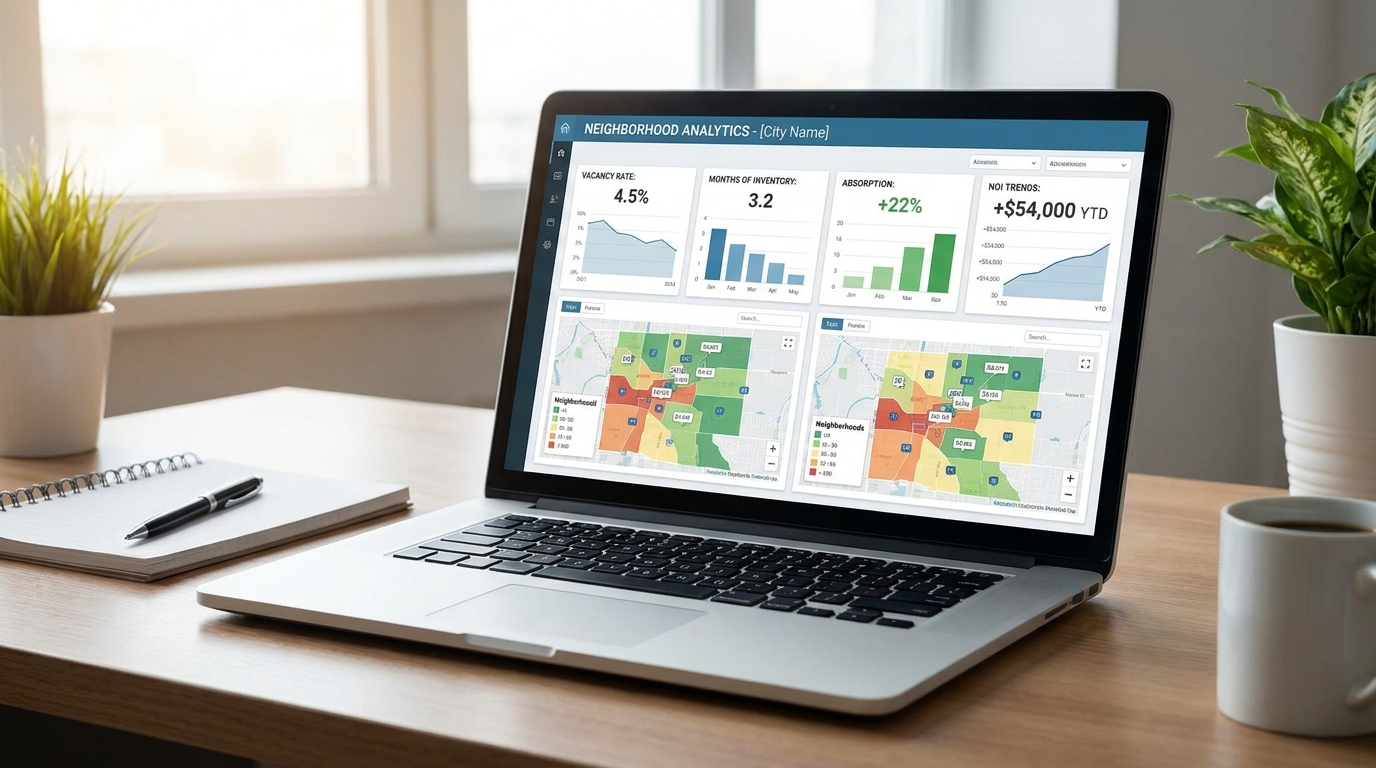
AI tools can summarize leasing reports, identify anomalies in operating expenses, classify maintenance requests, draft tenant communication, and surface trends from large property datasets faster than manual workflows. Dashboards can now combine internal property performance with external market feeds, giving managers a more current view of risk and opportunity. This does not replace judgment. It improves the quality and speed of information available to decision makers.
Predictive analytics is another area worth watching. Models can estimate renewal probability, turnover risk, late payment likelihood, or lease up pace under different pricing scenarios. These forecasts are never perfect, but they are useful when paired with human oversight and local market knowledge. The practical question is not whether AI is magical. It is whether it helps teams act earlier and more consistently. In many cases, it does.
Common Misconceptions That Distort Real Estate Analysis
Because real estate data is often summarized in headlines, a few misconceptions appear again and again. These assumptions can lead to expensive mistakes if they are not challenged.
- A low vacancy rate always means strong performance. A property can be full and still underperform if rents are mispositioned, expenses are high, tenant quality is weak, or major capital needs are being deferred. Occupancy is important, but profitability is broader than occupancy.
- Average rent growth tells you what tenants are paying. In reality, average growth can be distorted by turnover, incentives, new supply at different price points, and the mix of units in the dataset. Turnover rent and effective rent often tell a more useful story.
- National data is enough. It is not. Local, neighborhood, and property class conditions often matter far more than the national average. Analytics becomes actionable only when the market definition is specific enough.
- Cap rate alone determines value. Cap rate is useful, but value also depends on NOI quality, financing conditions, liquidity, lease rollover risk, and future capital requirements. A higher cap rate is not automatically a better opportunity.
- Analytics is only for investors. Property managers use analytics constantly, whether for renewals, budgeting, staffing, maintenance prioritization, or concessions strategy. In practice, operations and investment are deeply linked.
A Practical Workflow for Turning Data Into Decisions
The most effective analytics process is simple and repeatable. It starts with a question, gathers the right data, compares internal and external signals, and ends with a defined action. This can be done monthly for a small building or weekly for a larger portfolio. The point is consistency rather than complexity.
Step 1: Define the Decision
Start with a real business question. Are renewal increases too aggressive for current conditions? Should vacant units receive upgrades before relisting? Is one submarket becoming riskier than another? Analytics works best when it is tied to a decision, not just a report.
Step 2: Pull the Relevant Data
Use both internal and external sources. Internal data may include occupancy, renewal rates, delinquency, maintenance costs, leasing velocity, and turnover expense. External data may include CMHC rental reports, NAR housing indicators, local listing data, construction pipelines, mortgage rates, and demographic trends. The combination is what makes the analysis useful.
Step 3: Segment the Market
Group properties by neighborhood, asset quality, rent band, unit type, or tenant profile. This step prevents misleading averages. A building’s true competition is usually smaller and more specific than the metro area as a whole.
Step 4: Compare Trend Direction
Ask what is improving, worsening, or stabilizing. Are concessions rising even if asking rents are flat? Are renewal rates weakening before vacancy rises? Are operating costs climbing faster than revenue? Direction often matters more than the latest number on its own.
Step 5: Choose an Operational Response
The final step is action. That may mean adjusting renewal strategy, testing different pricing by unit type, reallocating maintenance spend, delaying a renovation program, or increasing marketing on slow moving inventory. Good analytics always ends with a decision, a timeline, and a way to measure the outcome.
Useful Data Sources and Tools
For Canada, CMHC remains one of the most authoritative sources for rental market reporting. Its datasets and reports include vacancy rates, average rents, vacancy by rent quartile, and percentile rents across urban centres. These details are especially useful for managers trying to understand where their property sits within a local market rather than relying on one broad city average.
In the United States, NAR provides widely followed indicators on sales pace, prices, and inventory, which help readers assess ownership market conditions and liquidity. For affordability context, Federal Reserve household housing data can be very helpful because it connects rates and payments to lived consumer pressure. Private sector research from firms such as CBRE, JLL, and NAIOP is also valuable, especially for sector specific outlooks and operational trends.
On the software side, many teams now use dashboard tools that combine PMS data, CRM leasing activity, spreadsheet models, and third party market feeds. The best tools are not necessarily the most complex. They are the ones that make comparison easy, surface changes quickly, and support recurring decisions without creating reporting fatigue.
What Good Market Analytics Looks Like in Practice
Imagine a manager overseeing a mid rise rental building in a market that has recently softened. Citywide headlines still show annual rent growth, but the building’s leasing team is seeing more negotiation on new leases. By digging deeper, the manager sees that vacancy has risen mainly in higher rent quartiles, nearby new buildings are offering incentives, and turnover rents are no longer climbing. Instead of applying a blanket rent cut, the team holds pricing on well performing one bedroom units, offers targeted concessions on larger units, and postpones a non essential amenity upgrade in favor of hallway improvements that matter more to current residents. That is analytics in action.
Now consider a small investor reviewing whether to refinance or sell. Cap rates in the market look stable, but operating expenses have jumped and renewal rates are softening. A shallow reading would focus only on valuation multiples. A better analysis shows NOI quality is weakening, which affects both financing and sale outcomes. The investor may decide to improve collections, reduce controllable expenses, and stabilize renewals before going to market. Again, the value comes from connecting market signals to operating realities.
Final Thoughts
Real estate market analytics is not just for large investors, institutional owners, or data specialists. It is a practical discipline for anyone who wants to make better property decisions with less guesswork. Whether you manage one building or a regional portfolio, the same principle applies: market conditions only become useful when translated into operational choices.
The key is to focus on the metrics that truly explain supply, demand, pricing, affordability, and operating performance. Watch vacancy, occupancy, turnover rent, absorption, months of inventory, NOI, and affordability together rather than alone. Pay attention to submarkets rather than relying on broad averages. Use AI and dashboards to increase speed, but keep judgment at the center.
Most importantly, remember that analytics is not about predicting the future perfectly. It is about improving the quality of the next decision. In real estate, that is often where the biggest advantage lives.

No Comment! Be the first one.