


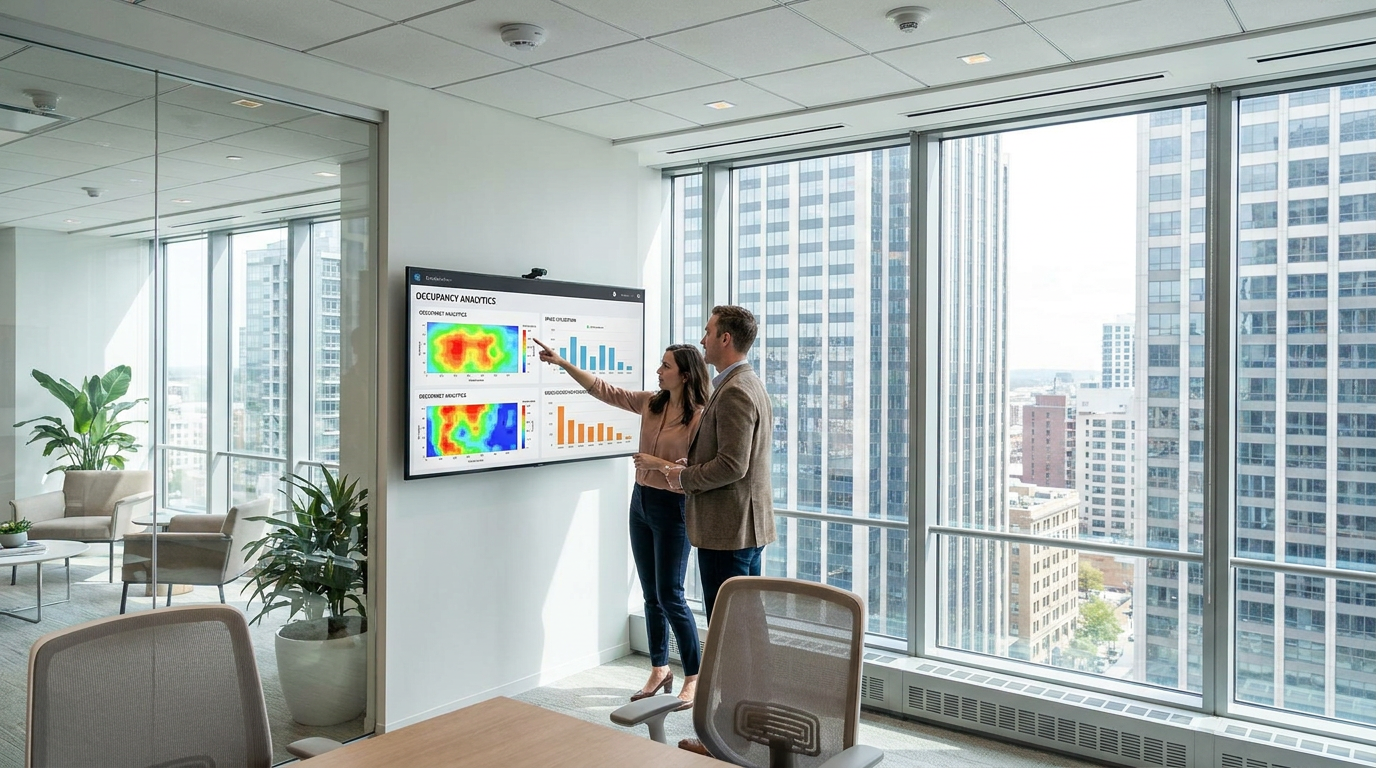
Real estate has always depended on good information, but the definition of useful information is changing quickly. For years, many decisions were built on broad indicators such as lease status, square footage, vacancy rates, and annual operating costs. Those metrics still matter, yet they do not tell owners and operators how people actually use a building from day to day. Occupancy analytics fills that gap by turning buildings into measurable environments where space use, timing, demand, and behavior patterns become visible.
Table Of Content
- What Occupancy Analytics Means in Real Estate
- Why Occupancy Analytics Matters More Now
- How Occupancy Analytics Works
- The Operational Benefits for Property Management
- Improving Comfort and Tenant Experience
- Portfolio Optimization and Space Strategy
- Why Occupancy Analytics Matters for Investors
- Occupancy Analytics and ESG Performance
- Privacy, Governance, and Trust
- Common Misconceptions That Hold Teams Back
- What an Effective Occupancy Analytics Strategy Looks Like
- The Future of Occupancy Analytics in Real Estate
- Conclusion
At its core, occupancy analytics is the practice of collecting and analyzing data about how spaces are used so real estate teams can make better decisions. In practical terms, that can mean understanding which floors are crowded on Tuesdays, which meeting rooms sit empty most of the week, when HVAC systems are conditioning space no one is using, or whether a tenant’s footprint still matches the way their employees work. This is why occupancy analytics now sits at the intersection of property management, smart building operations, workplace strategy, and real estate investment.
The timing matters. Hybrid work has disrupted old assumptions about office utilization. Energy costs remain a major concern. ESG reporting is becoming more important. Occupiers are increasingly selective about quality, comfort, and flexibility. At the same time, investors want clearer signals about which assets are efficient, resilient, and likely to retain demand. In that environment, occupancy analytics is not a niche technology trend. It is becoming part of the intelligence layer behind better real estate decisions.
This article explores what occupancy analytics really means, how the technology works, where it creates value, and why the most forward-looking owners and investors are building it into their strategy. The central idea is simple: when you understand how a property is actually used, you can operate it more efficiently, serve tenants better, and invest with more confidence.
Occupancy analytics is not just about counting people. It is about understanding patterns, timing, intensity of use, and the relationship between building demand and building performance.
What Occupancy Analytics Means in Real Estate
One of the most common misconceptions is that occupancy analytics is the same as vacancy analysis. It is not. Vacancy rate is a leasing metric that shows whether space is rented or empty at the market or building level. Occupancy analytics measures how space is actually used once it exists inside a property or portfolio. A fully leased building can still be underused, poorly configured, expensive to operate, or mismatched with tenant behavior. That is the difference between contractual occupancy and functional occupancy.
For a property owner, this difference matters because operational waste often hides inside leased space. A floor may be heated, cooled, lit, cleaned, and serviced as if it is busy every day, even though actual attendance peaks only on certain days. A tenant may feel short on meeting space while dozens of desks remain underused. A portfolio manager may be considering an expensive expansion when better utilization data would support reconfiguration instead. Without occupancy analytics, these decisions rely too heavily on assumption.
Occupancy analytics typically looks at several dimensions at once. It can measure how many people are in a space, when they arrive, how long they stay, which rooms they prefer, how peak demand varies by day, and where pressure points appear over time. In more advanced systems, this data is linked with HVAC, lighting, access control, calendar systems, amenity usage, and energy performance. The result is a more complete view of the relationship between people and property.
While office buildings are the most discussed use case, occupancy analytics extends well beyond offices. Retail operators use it to evaluate shopper flow and staffing needs. Multifamily owners can assess amenity usage and common area demand. Healthcare operators can improve patient flow and room scheduling. Industrial facilities can monitor activity patterns and operational bottlenecks. Mixed-use developments can use occupancy analytics to better coordinate shared services and common infrastructure across different property types.
Why Occupancy Analytics Matters More Now
The rise of hybrid work is one of the biggest reasons occupancy analytics has moved to the center of commercial real estate strategy. Traditional occupancy planning assumed relatively stable weekday attendance. That model no longer reflects reality in many markets. Demand now fluctuates by day, team, season, and lease cycle. Some buildings experience crowding on peak collaboration days and low attendance the rest of the week. Others discover that high-profile amenity spaces are overused while large desk areas are mostly idle. This new pattern makes static planning ineffective.
Major industry organizations are acknowledging this shift. Canadian market outlooks from firms such as CBRE and Colliers increasingly emphasize analytics, AI, utilization insights, and benchmarking as part of the modern office strategy. CBRE Canada’s 2026 workplace and occupancy research explicitly centers on using AI and analytics to optimize space and inform decisions, supported by years of benchmarking and sentiment surveys. That signals a larger change in the industry. Occupancy is no longer treated as a rough estimate. It is becoming a dynamic performance indicator.
Market conditions also reinforce the need for better data. Colliers Canada reported that national office vacancy declined to 13.6% in the first quarter of 2026, but those trends remain highly market specific. At the same time, office recovery is uneven across markets and building classes. In that kind of environment, broad market averages are useful but insufficient. Owners need asset-level evidence showing whether their buildings are actually attracting people, supporting tenant needs, and operating efficiently enough to remain competitive.
Another reason occupancy analytics matters now is cost pressure. Energy, labor, maintenance, and capital costs have all become more visible line items in property operations. If a building is conditioned, illuminated, and serviced based on outdated assumptions, even small inefficiencies compound into meaningful losses. Analytics gives operators a way to align services with actual demand rather than habitual schedules. That is one of the clearest pathways from data insight to stronger net operating income.
How Occupancy Analytics Works
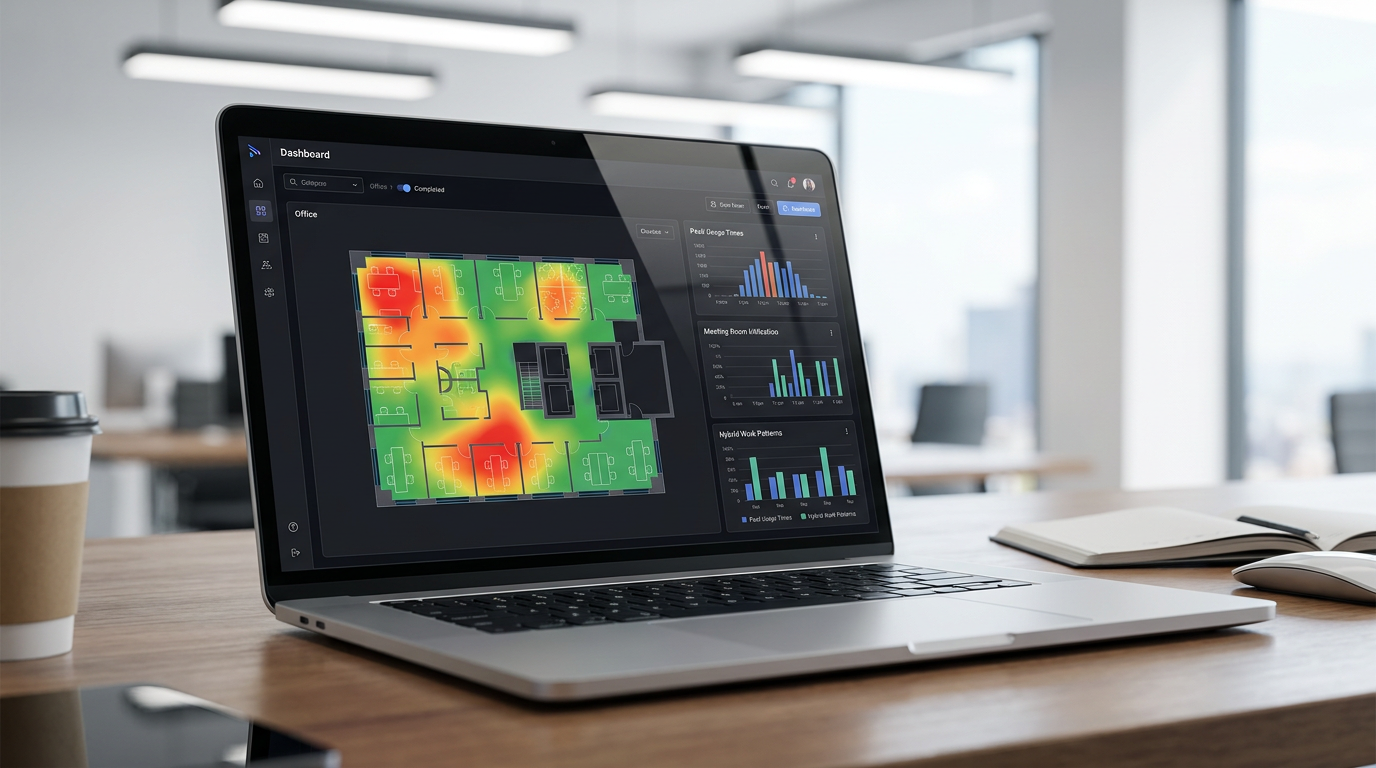
The technology behind occupancy analytics is more varied than many people expect. There is no single data source that defines a complete occupancy picture. The best systems usually combine multiple inputs, then clean, reconcile, and analyze the information through a dashboard or smart building platform. This allows teams to move from raw counts toward meaningful operational and strategic insight.
Common data sources include people-counting sensors, motion sensors, desk or room sensors, Wi-Fi and Bluetooth signals, badge access records, elevator activity, reservation systems, and calendar data. In some advanced environments, operators also use computer vision systems or digital twin models. Each source has strengths and limitations. Badge data shows entries, but not necessarily where people go afterward. Motion sensors may capture presence but not occupancy density. Wi-Fi data can suggest traffic patterns, but it may require careful calibration to avoid overcounting devices.
The goal is not simply to accumulate more data. In fact, one of the biggest risks in occupancy analytics is assuming that volume guarantees accuracy. Poor sensor placement, bad commissioning, weak integrations, or biased sampling can lead to misleading conclusions. A dashboard that looks sophisticated can still produce the wrong answer if the underlying signals are incomplete or inconsistent. This is why governance, calibration, and validation matter as much as software design.
Once data is collected, analytics tools can transform it into practical outputs such as heat maps, utilization rates, peak-day reports, dwell-time patterns, room demand forecasts, service triggers, and comparative benchmarks. Some systems also use machine learning to identify trends that may not be obvious through manual review. For example, an AI-enabled dashboard might detect that collaboration spaces are under pressure only when a specific tenant team is on-site, or that HVAC usage spikes hours before actual occupancy begins.
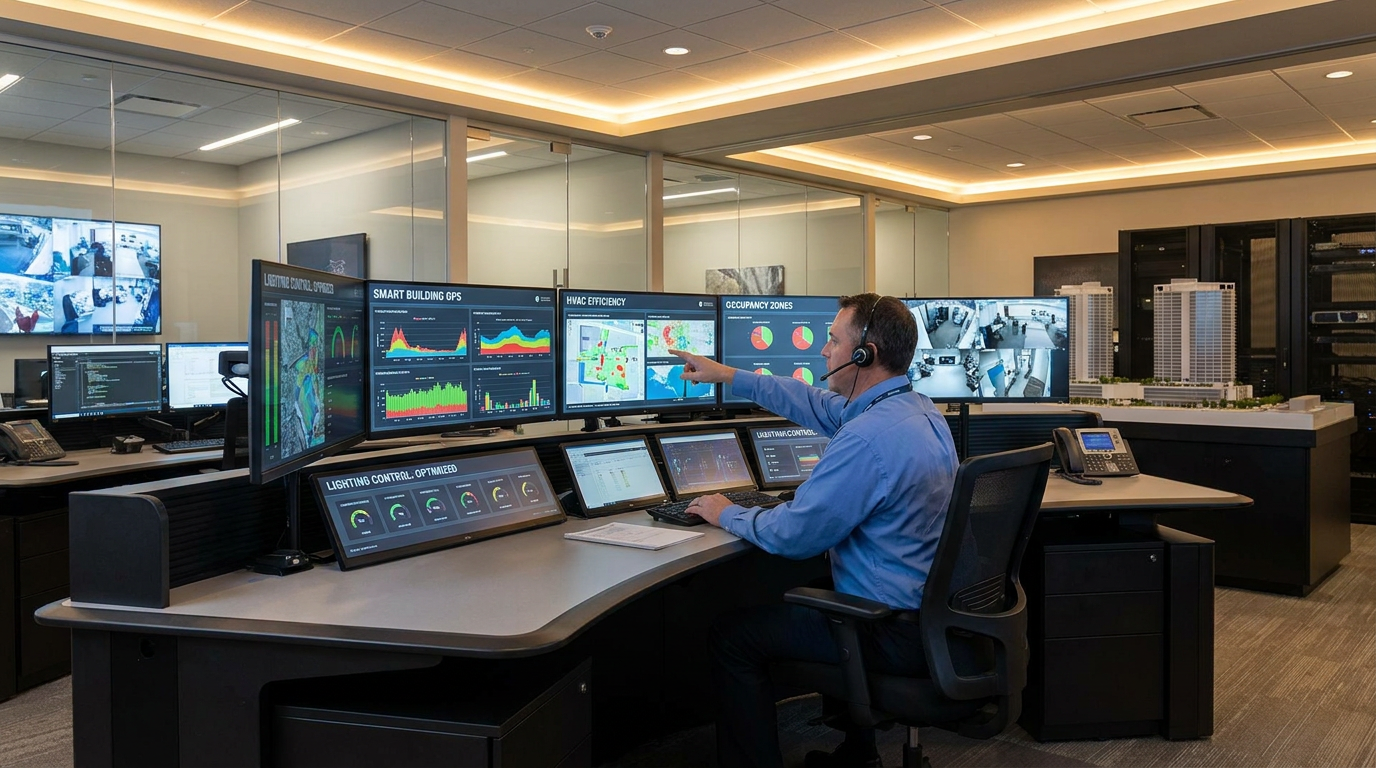
As systems become more integrated, occupancy analytics increasingly connects to building automation systems, energy management platforms, and workplace apps. This creates a more responsive operating model. Instead of reviewing occupancy data after the fact, the building can adapt in near real time. Lighting can dim in vacant zones, ventilation can ramp up when demand increases, and cleaning schedules can be adjusted based on actual use rather than fixed assumptions. That is where occupancy data shifts from reporting to performance.
The Operational Benefits for Property Management
For property managers, occupancy analytics creates immediate practical value because it reveals where building operations are out of sync with real use. Many buildings still follow schedules that were designed for a more predictable era. Lights turn on for entire zones whether or not they are occupied. HVAC runs for long blocks of time to serve floors with minimal attendance. Janitorial teams clean every room at the same frequency despite radically different usage levels. These patterns are expensive, and they are often invisible until data makes them visible.
One of the most important benefits is smarter energy management. The U.S. Department of Energy identifies occupancy sensing, analytics, and occupant-centric control strategies as important building-efficiency measures. DOE materials note that occupancy-aware controls can reduce unnecessary HVAC and lighting operation during unoccupied periods, and some projects target around 20% energy savings through occupancy-informed model predictive control. DOE also points to advanced analytics and controls as a path to roughly 10% additional building energy savings beyond existing measures. In operational terms, this means occupancy analytics can support both cost reduction and decarbonization.
Lighting is a straightforward example. DOE guidance on wireless occupancy sensors states that occupancy sensors can increase lighting energy savings by turning lights off or down when spaces are vacant, though results vary by room type and commissioning quality. In a large office or mixed-use property, those savings add up. More important, however, is that the lighting strategy becomes demand-based instead of assumption-based. The building stops behaving as if every room must perform at peak capacity all day.
HVAC optimization is often even more significant. Heating or cooling unoccupied areas is one of the classic forms of energy waste in commercial property. When occupancy data is linked to HVAC zoning and controls, facilities teams can better match ventilation and thermal conditioning to actual usage. This is especially valuable in hybrid office settings where occupancy may surge on certain days and fall sharply on others. Instead of conditioning the whole building at full intensity, operators can make more precise adjustments.
Cleaning and staffing also benefit. A conference suite used three times in a day does not require the same treatment as a nearly empty floor. Restrooms near busy collaboration areas may need more frequent service than those near underused desk banks. Front desk staffing, security coverage, and maintenance rounds can also be aligned to traffic patterns. These are not glamorous examples, but they show why occupancy analytics matters in real operating budgets. Better alignment between service delivery and actual use improves efficiency without automatically reducing quality.
Improving Comfort and Tenant Experience
It is tempting to frame occupancy analytics as a pure efficiency tool, but that misses one of its strongest benefits. Good occupancy data can improve the tenant experience because it helps owners and operators design services around how people really use the space. If occupants routinely struggle to find meeting rooms on peak days, analytics can reveal whether the problem is actual shortage, poor distribution, or ineffective booking behavior. If certain collaboration zones are crowded while other areas feel dead, the issue may be space mix rather than total square footage.
Comfort is another major factor. Occupants rarely describe their building experience in terms of analytics, but they notice when a room is too hot, too cold, too dark, too noisy, or too crowded. Occupancy-informed controls can help reduce those mismatches. Better airflow in occupied rooms, less overcooling of empty areas, and improved alignment between peak demand and support services all contribute to a more usable environment. Over time, that can influence satisfaction, retention, and even a tenant’s decision to renew.
For landlords competing in uneven office markets, this is especially relevant. If two buildings offer similar rents but one can demonstrate better comfort, smarter amenities, and more responsive operations, the data-backed property has a stronger story. Occupancy analytics therefore supports not just operational quality, but market positioning. It gives owners evidence that they understand how people use the building and that they are managing it accordingly.
Portfolio Optimization and Space Strategy
One of the most powerful uses of occupancy analytics is portfolio optimization. Real estate portfolios are often managed using high-level metrics that can miss underperformance at the floor, suite, or space-type level. Occupancy analytics gives asset managers a finer lens. Instead of asking only whether a building is leased, teams can ask whether its space mix matches user behavior, whether demand is concentrated in the right areas, and whether the current footprint is helping or hurting overall value.
Consider a tenant with a large office footprint spread across multiple floors. Traditional reporting may show the lease is stable, rent is paid, and the occupancy cost per square foot is known. But occupancy analytics might reveal that two floors are consistently underused, peak attendance occurs only on certain weekdays, and collaboration spaces are overbooked while assigned desks remain largely empty. That insight opens several strategic options. The tenant might right-size at renewal, consolidate floors, redesign the layout, or reallocate more square footage to shared work settings. The landlord can use the same data to shape negotiations, support reconfiguration, or market reclaimed space more effectively.
At the portfolio level, this becomes even more valuable. Owners can compare utilization patterns across buildings, identify which assets support stronger in-person attendance, and spot where capex would produce the most meaningful operational or leasing benefit. An underused asset may need repositioning. A highly active building with space pressure may justify targeted amenity investment. A property showing stable leasing but weak in-building utilization may require closer tenant engagement before future renewals become a risk.
Occupancy analytics also supports amenity planning. It can show whether lounge areas, fitness spaces, meeting centers, parking facilities, and food service offerings are aligned with actual demand. This is important because amenity investment is not cheap, and the wrong amenity strategy can erode returns. Better data helps owners avoid spending based on trend imitation alone. Instead, they can invest where usage patterns support a stronger business case.
Why Occupancy Analytics Matters for Investors
From an investment perspective, occupancy analytics turns a building from a static income-producing asset into a measurable operating system. That change matters because many of the risks and opportunities in real estate are behavioral, not just financial. How tenants use space affects operating costs, comfort, retention, capex priorities, and future leasing strategy. Yet many underwriting models still depend more heavily on rent rolls and historical expenses than on real utilization patterns. Occupancy analytics closes that gap.
For acquisitions, utilization data can improve due diligence. A building may appear healthy on paper, but poor visibility into actual usage can hide inefficiencies. If occupancy analytics reveals extensive energy waste, underused tenant areas, poor amenity fit, or service models disconnected from demand, the buyer gains a better understanding of operational risk and value-add potential. That can influence pricing, capex planning, and post-acquisition strategy.
For asset management, occupancy insights support stronger decision-making throughout the hold period. They can inform tenant improvement planning, parking allocation, leasing strategy, service levels, and capital prioritization. If one asset consistently demonstrates stronger attendance and better amenity use than comparable buildings, that may validate further investment. If another property struggles with weak in-building engagement despite stable leases, the owner can investigate before those issues show up in renewal weakness or pricing pressure.
Occupancy analytics can also strengthen the investment thesis for higher-quality buildings. CBRE Canada’s market outlook has noted that office recovery remains uneven across building classes and markets. That means the ability to prove real usage, operational efficiency, and tenant stickiness is becoming more valuable. Data can help show that a property is not just leased, but meaningfully used and competitively positioned. In a market where tenant preferences are shifting toward better-performing assets, that evidence matters.
There is also a growing connection between occupancy analytics and valuation logic. Buildings that can demonstrate efficient operation, lower waste, stronger tenant experience, and more adaptive space strategy may support stronger NOI and lower perceived risk over time. Occupancy data will not replace traditional valuation methods, but it adds a useful intelligence layer. The more uncertain market conditions become, the more valuable that layer is likely to be.

Occupancy Analytics and ESG Performance
Occupancy analytics is increasingly linked to sustainability strategy because occupancy is one of the clearest variables affecting building resource use. A building does not consume energy in the abstract. It consumes energy to support activity, comfort, lighting, ventilation, and equipment across occupied and unoccupied space. When operators understand actual occupancy patterns, they can reduce waste without reducing service quality. That is why occupancy-aware controls have become an important building-efficiency pathway.
For ESG reporting, this matters on several levels. First, occupancy-informed operations can lower energy consumption and reduce emissions. Second, the data can support more credible narratives around building performance and decarbonization planning. Third, it can help owners identify where efficiency upgrades will have the greatest real-world impact. Instead of applying the same strategy everywhere, they can target zones, systems, or assets where occupancy behavior and energy mismatch are most pronounced.
This does not mean occupancy analytics is a standalone sustainability solution. Buildings still require upgrades to equipment, controls, envelope performance, and energy sourcing. But occupancy data helps those investments work better by adding operational intelligence. It tells the building when demand is real and when it is not. In practice, that can improve both emissions performance and financial efficiency, which is exactly the kind of overlap ESG-minded investors increasingly want to see.
Privacy, Governance, and Trust
As occupancy analytics becomes more common, privacy and governance are becoming non-negotiable. Occupancy systems often rely on sensor, badge, network, or camera-derived data. If owners implement these tools without clear rules, transparent communication, and proper aggregation, they risk undermining trust. This is particularly important in workplaces, where occupants may be sensitive to anything that appears overly intrusive or tied to individual surveillance.
The best occupancy analytics programs are designed around privacy from the start. That means focusing on aggregate patterns rather than individual behavior whenever possible, clarifying data purpose, limiting retention, controlling access, and ensuring compliance with applicable laws and internal policies. Governance should also cover data quality, vendor accountability, consent structures where relevant, and clear separation between workplace planning and employee monitoring concerns.
Good governance is not just about risk reduction. It also improves the usefulness of the analytics itself. When tenants and occupants understand what is being measured and why, adoption tends to be smoother and data practices become more sustainable. Trust supports better implementation. In a field that depends on long-term measurement, that trust is a strategic asset.
Common Misconceptions That Hold Teams Back
Several misconceptions continue to limit adoption. One is the belief that occupancy analytics is relevant only for office buildings. In reality, the same principles apply across retail, multifamily, healthcare, education, logistics, and mixed-use assets. Anywhere that space use affects cost, comfort, staffing, or planning can benefit from better occupancy visibility.
Another misconception is that occupancy analytics is only about cutting costs. Cost control is important, but many of the strongest gains come from improving fit and experience. A better-calibrated building is often a more attractive building. Smarter service levels, better comfort, improved amenity planning, and more responsive layouts can support retention and revenue as much as they support savings.
A third misconception is that more data automatically leads to better decisions. It does not. If sensors are poorly calibrated, systems are not integrated, or dashboards are interpreted without context, data can create false confidence. The objective is not data accumulation. It is decision quality. Teams need clean inputs, useful metrics, and clear operational workflows that turn insight into action.
Finally, some people assume occupancy analytics simply answers the question of how many people are present. That is too narrow. The real value comes from patterns over time, peak-day dynamics, space-type performance, dwell time, circulation behavior, and the interaction between occupancy and building systems. Counting people is a starting point. Understanding use is the real goal.
What an Effective Occupancy Analytics Strategy Looks Like
For organizations considering occupancy analytics, the best starting point is not technology. It is the business question. Are you trying to reduce energy waste, improve hybrid-work planning, optimize cleaning schedules, support lease renewals, prioritize capex, or compare assets across a portfolio? Different goals require different data resolutions, system integrations, and reporting structures. A clear question helps prevent overspending on tools that do not match the use case.
Once the objective is clear, teams should think in layers. The first layer is data collection, which may involve sensors, network signals, badges, or existing workplace systems. The second layer is integration and validation, where data quality is tested and reconciled. The third layer is analytics and visualization, where patterns become understandable. The fourth layer is action, which is where many organizations struggle. A dashboard is useful only if facilities teams, property managers, leasing teams, and asset managers know how to apply what they see.
It also helps to establish a regular decision rhythm around the data. Weekly reviews may focus on operational issues such as peak-day service demand and HVAC timing. Monthly reviews may look at utilization patterns, tenant engagement, or cleaning efficiency. Quarterly reviews may support capex planning, leasing discussions, and broader portfolio optimization. Occupancy analytics creates the most value when it is embedded into recurring management processes rather than treated as a one-time study.
Organizations should also benchmark where possible. CBRE Canada’s emphasis on five years of benchmarking and workplace sentiment reflects an important point. Utilization data is more powerful when teams can compare it over time or against similar assets. A 45% average attendance figure means little by itself. Its value depends on whether that rate is rising, stable, or weak relative to comparable buildings, tenant profiles, and service models.
The Future of Occupancy Analytics in Real Estate
The field is moving from simple occupancy counting toward broader workplace intelligence and AI-enabled space optimization. That evolution will likely continue. As systems become more integrated, occupancy data will increasingly interact with leasing models, digital twins, energy forecasting, tenant apps, and predictive maintenance platforms. Instead of isolated reports, owners will have more continuous visibility into how behavior shapes building performance.
Artificial intelligence will play an expanding role, especially in finding patterns across complex datasets. In large portfolios, it is difficult for human teams to manually identify every utilization anomaly, demand spike, or service mismatch. AI can help surface those patterns faster, though it still depends on reliable data and sound governance. Used well, it can move occupancy analytics from descriptive reporting toward more predictive and prescriptive decision support.
We are also likely to see occupancy analytics become more embedded in leasing and asset marketing. Prospective tenants may increasingly expect evidence that a building supports efficient, comfortable, hybrid-friendly operations. Investors may place more weight on operational intelligence as part of risk assessment. In that environment, buildings that can prove performance with data could enjoy a meaningful competitive advantage.
Conclusion
Occupancy analytics is becoming one of the most practical and valuable tools in modern real estate. It helps owners, operators, and investors see what traditional metrics often miss: how people actually use space, when demand rises, where inefficiencies hide, and which properties are truly aligned with current behavior. That visibility supports better operations, better tenant experience, stronger sustainability outcomes, and better investment decisions.
The most important lesson is that occupancy analytics is not a replacement for real estate fundamentals. It is a layer of intelligence that makes those fundamentals more actionable. Leasing, asset quality, location, and market conditions still matter. What occupancy analytics adds is precision. It helps decision-makers move beyond averages and assumptions toward evidence about how buildings perform in the real world.
As hybrid work, ESG pressure, and portfolio scrutiny continue to shape the industry, that precision will become more valuable. Buildings that can align services, energy use, space strategy, and capital planning with actual utilization will be better positioned to protect NOI and remain competitive. In a market that increasingly rewards adaptability, occupancy analytics offers something every real estate stakeholder needs: clearer signals and smarter decisions.


No Comment! Be the first one.