


How to Effectively Monitor Your Solar System’s Performance
For many homeowners, installing solar feels like the big milestone. The panels go up, the inverter is switched on, and clean electricity starts flowing into the home. But once the excitement of installation passes, a quieter question matters just as much: How do you know your solar system is actually performing the way it should? The good news is that monitoring a home solar system is usually much simpler than people expect. You do not need to be an engineer, and you do not need to spend your evenings studying electrical diagrams.
Table Of Content
- Why Monitoring Your Solar System Matters
- Start With the Easiest Tool: Your Inverter or Solar App Dashboard
- Understand the Numbers That Matter Most
- Build a Baseline Instead of Chasing Perfection
- What Normal Variation Looks Like
- How Often Should You Check Your Solar System?
- Warning Signs That Deserve Attention
- Simple Visual Checks You Can Do Safely
- Panels Are Only Part of the Story
- How to Compare Actual Production With Expected Production
- Weather, Snow, and Seasonal Reality in Canada and Northern Climates
- When to Clean Panels and When to Call a Professional
- A Simple Monthly Solar Monitoring Routine
- How Monitoring Protects Long Term Value
- Final Thoughts: Keep It Simple, Stay Consistent
At its core, solar performance monitoring is about answering three practical questions. Is your system producing what it should be producing for the season and weather. Is it producing consistently over time. And is anything changing that deserves attention. If you can answer those questions with reasonable confidence, you are already doing the kind of monitoring that helps protect your investment, improve system reliability, and make conversations with your installer much easier if a problem appears.
Natural Resources Canada notes that energy monitoring in homes with solar photovoltaic systems can give homeowners valuable feedback on both household energy use and PV performance, including real time and historical production and consumption data. That is an important point because good monitoring is not only about watching a number rise on a sunny afternoon. It is also about understanding the relationship between your system, your home, the weather outside, and the long term health of the equipment itself.
In this guide, we will walk through a homeowner friendly approach to monitoring solar performance without unnecessary jargon. You will learn how to use your inverter or app dashboard, how to establish a realistic baseline, what normal fluctuations look like, which warning signs deserve attention, and when it makes sense to call a professional. Along the way, we will also introduce a few useful terms such as AC power, irradiance, performance ratio, availability, and degradation so you can understand your system more confidently and have better discussions with installers or service providers.
Why Monitoring Your Solar System Matters
Solar systems are often described as low maintenance, and that is true in many respects. Unlike a furnace or an air conditioner, a rooftop PV system has no complex moving parts exposed to daily use inside the home. But low maintenance does not mean no oversight. Even a well designed system can experience inverter faults, communication issues, wiring problems, temporary shading, soiling, snow buildup, or gradual age related decline. Monitoring helps you notice those changes before they quietly reduce savings for months or years.
There is also a financial reason to pay attention. Your solar system is not only an environmental upgrade. It is a long term asset. If production drops significantly and no one notices, your utility savings fall too. A monitoring habit gives you a practical way to preserve return on investment. NREL has noted that monitoring programs can range from basic annual checking to sophisticated data systems, and even basic monitoring can reveal faults, availability issues, and degradation. In other words, you do not need a commercial grade control room to benefit from oversight.
Monitoring also helps reduce unnecessary worry. One of the most common homeowner misconceptions is that every sunny day should produce a perfect peak. In reality, solar output varies naturally with season, temperature, panel orientation, cloud cover, tree shade, snow, and dirt on the modules. A system can look weak on a cold cloudy morning or after a snow event and still be functioning normally. Good monitoring replaces guesswork with context.
The goal is not to chase a perfect daily number. The goal is to understand what is normal for your home, your roof, your climate, and your system so that real problems stand out clearly.
For households with batteries or whole home energy monitoring, the value grows further. You can begin to see not only what the solar array produces, but also when your home uses energy, how battery charging and discharge affect your load profile, and whether your habits are helping you use more of your own clean power. That kind of visibility can make a solar system feel less like a black box and more like an active part of the home.
Start With the Easiest Tool: Your Inverter or Solar App Dashboard
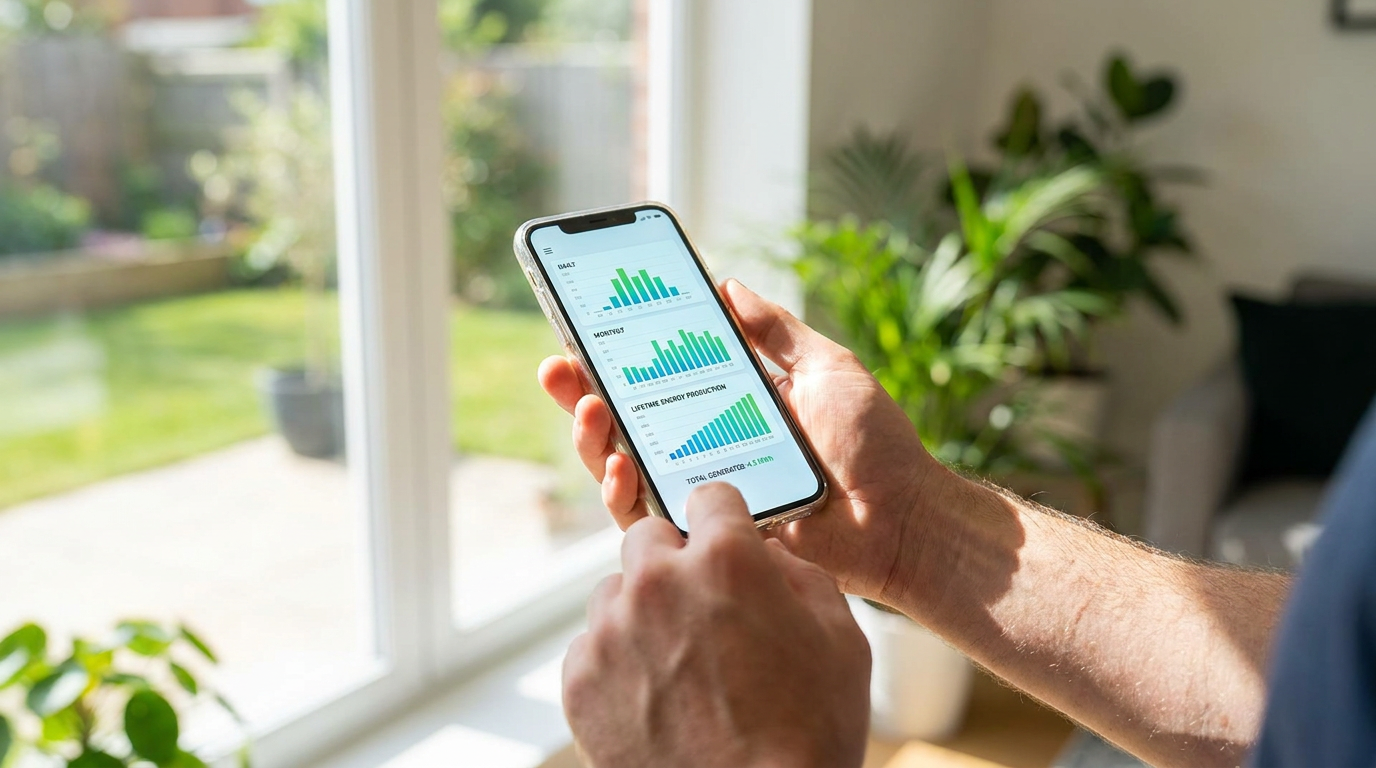
For most homeowners, the best place to start is the inverter display or the online portal that came with the installation. Many modern solar systems include app based monitoring that shows daily, monthly, yearly, and lifetime production. Some setups also include home consumption monitoring, which is especially useful because production alone does not tell the whole story. A home can produce a healthy amount of solar electricity and still import power from the grid at certain times of day depending on usage patterns.
When you first open your dashboard, it helps to focus on a small set of useful indicators. Look for current power output, daily energy production, monthly production totals, and lifetime generation. If your system includes consumption tracking, also note household use, grid imports, grid exports, and battery status if one is installed. You do not need to understand every graph immediately. The practical aim is to become familiar with the normal rhythm of your system.
Some homeowners check their apps constantly for the first few weeks and then stop looking altogether. A calmer, more useful rhythm is to glance at the system during obviously sunny periods, check the daily result from time to time, and review monthly totals more intentionally. This gives you enough awareness to notice meaningful changes without becoming distracted by natural hour to hour fluctuations.
It is also worth confirming that monitoring itself is working. A communication issue can interrupt the app even while the system continues producing electricity normally. One common misconception is that if the app is down, the solar array must be down too. Sometimes that is true, but often it is simply a connectivity problem between the inverter, your internet connection, and the monitoring platform. If the app looks inactive, compare it with your utility bill trend, inverter lights, or any on device display before assuming the worst.
Understand the Numbers That Matter Most
You do not need to master technical performance modeling, but a few key terms are helpful. AC power is the electricity your inverter delivers in the form your home uses. Solar panels produce direct current, or DC, and the inverter converts it to AC. Most homeowner dashboards focus on AC energy production because that is the practical output affecting your home and the grid connection.
Irradiance is the amount of solar energy hitting the panels. More specifically, professionals often refer to plane of array irradiance, which means the sunlight reaching the surface of the solar modules at their installed angle. This matters because your system cannot produce the same output on two days with very different solar conditions. If the sun exposure is lower, lower production can be completely normal.
Availability refers to whether the system is actually up and able to operate. A perfectly clean, efficient solar array produces nothing if an inverter fault keeps it offline. That is why a system that has strong components can still underperform in practical terms. Degradation means gradual loss of performance over time as equipment ages. According to NREL fleet research, median solar performance loss is about 0.75 percent per year, and 90 percent of systems in the dataset lost less than 2 percent per year. That means a modest year to year decline is expected. It does not automatically mean your system is failing.
You may also encounter the term performance ratio, often shortened to PR. This is a way of comparing actual output to the output that would be expected under the measured conditions. Homeowners do not always need to calculate it themselves, but it is a useful concept because it shifts attention away from raw production numbers alone. A low production day is not necessarily a problem if the weather was poor. What matters is whether production was low relative to the conditions.
Build a Baseline Instead of Chasing Perfection
The single most useful thing a homeowner can do is establish a baseline. That baseline is not one magic number. It is a pattern. Your solar system will naturally produce more in some months than others. It may perform especially well on cool, bright spring days and less dramatically during very hot periods because panel temperature affects efficiency. In colder climates, snow cover may temporarily suppress output and then production rebounds once panels clear.
This is why experts emphasize comparing like with like. A cloudy November day should not be compared with a clear June day. A month with several snowstorms should not be judged against a dry shoulder season month. Monitoring is far more useful when you compare similar periods and conditions. Look at this March compared with last March, or this sunny week compared with a similar sunny week in the same season. Patterns become much more meaningful when the context is consistent.
A simple homeowner baseline can include the following records:
- Expected seasonal pattern, based on the installer estimate or your first full year of operation.
- Typical monthly production totals, especially for shoulder seasons, summer, and winter.
- Typical daily production on clear days in different parts of the year.
- Any recurring weather related effects, such as snow accumulation, afternoon tree shade, or summer heat.
- Notable equipment messages, including inverter warnings, communication dropouts, or battery alerts.
If you are in your first year with solar, your baseline will be rough at first. That is fine. Start by saving monthly screenshots or notes from your app. Over time, you will create a useful reference point. If you have had the system for several years, you likely already have enough history in the app to review trends and identify what normal performance looks like in your home.
This practical baseline matters more than trying to predict exact hourly output. NREL and other performance guidance emphasize comparing measured AC production to expected output under real operating conditions. For homeowners, that simply means learning the shape of your system’s behavior so sudden changes are easy to spot.
What Normal Variation Looks Like
One of the easiest ways to become confident with solar monitoring is to understand that variation is normal. Output changes every day because the energy source itself changes every day. Weather is the most obvious factor, but not the only one. A bright but cool day can sometimes produce stronger results than an equally sunny but very hot day because panels tend to operate more efficiently at lower temperatures. The angle of the sun also changes through the year, affecting both the length and intensity of solar exposure.
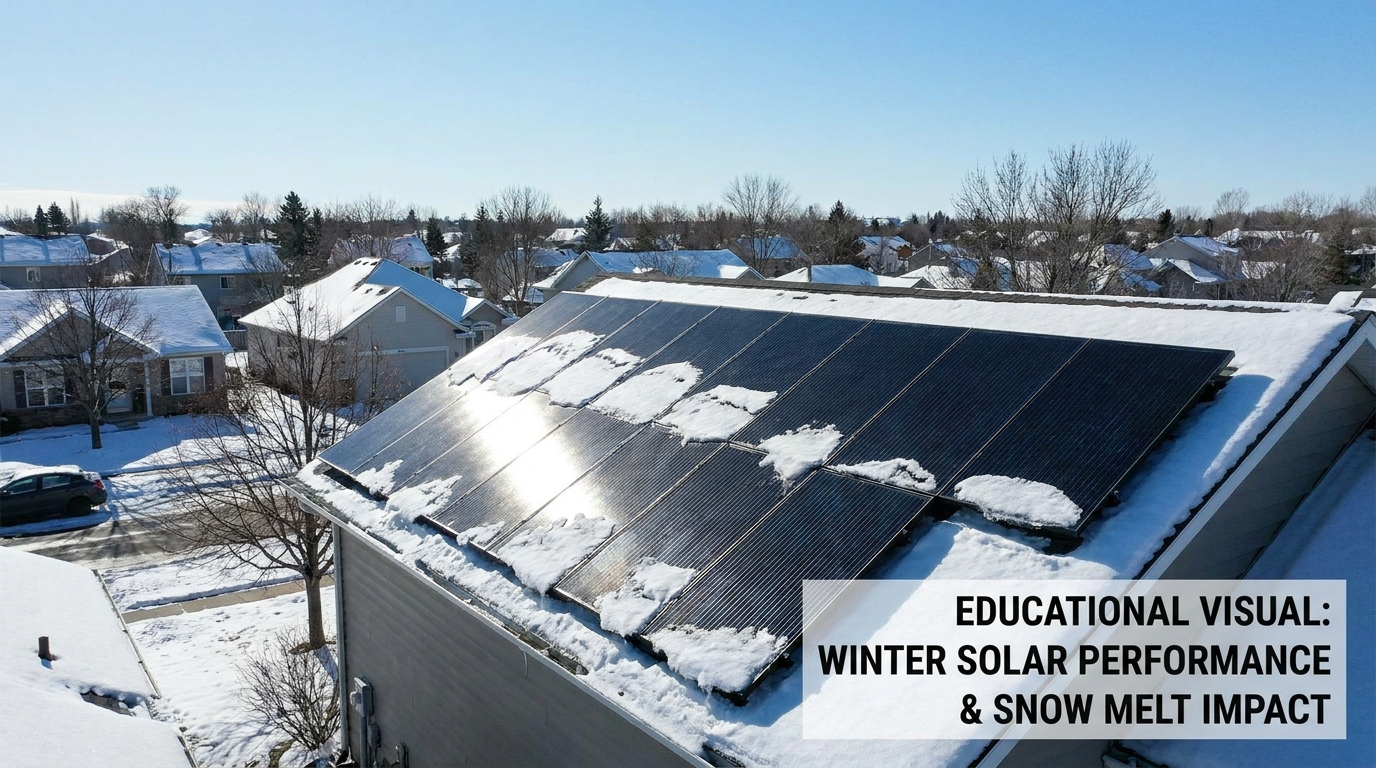
Shading can be another major influence. A nearby tree may cast longer shadows in the early morning or late afternoon during certain months. Dirt, pollen, leaves, and urban dust can gradually reduce output, though in many climates the effect is modest until buildup becomes more significant. In snowy regions, a single storm can suppress production sharply for a short period. Once the modules clear, the system often returns to normal.
This is where context becomes essential. NRCan guidance and broader performance research both point to the importance of interpreting output in light of conditions. A system that seems weak on a cloudy day may actually be performing exactly as expected. In colder climates especially, brief output dips may be weather related rather than a hardware fault. Homeowners who know this are less likely to panic over normal winter behavior and more likely to notice the changes that truly matter.
As a rule of thumb, gradual change is usually normal, while sudden change deserves closer attention. A small year to year decline can reflect expected degradation. A sharp unexplained drop in output, particularly if weather and season are similar to previous periods, deserves investigation. This distinction helps keep monitoring grounded and practical.
How Often Should You Check Your Solar System?
A healthy monitoring routine should feel sustainable, not obsessive. For most homeowners, a light touch works well. A quick glance once or twice a week is enough to confirm the system is active and behaving normally. A more thoughtful monthly review is where the real value lies. That is when you can compare production totals, notice whether communication outages have occurred, and decide whether any trends look unusual.
If your system is new, you may check more often for the first couple of months simply to learn its patterns. That is completely reasonable. Over time, most people benefit from settling into a routine that includes a short dashboard review, an occasional visual inspection from the ground, and a seasonal check after major weather events such as snowstorms, windstorms, or heavy pollen periods.
There is also a place for annual review. Once a year, compare your total generation against the previous year and against the installer’s expected model if you have it. Because weather differs year to year, the annual number should not be treated as an absolute verdict. Still, it can help you identify whether your system is aging normally or whether an extended underperformance pattern is emerging.
Warning Signs That Deserve Attention
While many fluctuations are harmless, some signals are worth taking seriously. The first is production that is clearly lower than expected for the same season and similar weather. If last year’s bright April days regularly produced much more than this year’s bright April days, something may have changed. The second signal is recurring inverter faults or repeated communication outages. A one off interruption is often minor. A repeated pattern suggests the system needs closer review.
Unexpected nighttime power behavior can also be informative, particularly on systems with consumption monitoring or batteries. Your panels should not be producing at night, of course, but the app may reveal odd inverter behavior, phantom usage patterns, or battery cycling that seems inconsistent with your setup. That does not always point to a solar equipment problem, but it can signal something in the broader home energy system worth understanding.
Visible changes on the roof also matter. New shade from growing trees, construction next door, debris buildup, obvious dirt accumulation, or snow that lingers on one section of the array longer than expected can all affect output. If a section of the array appears persistently different, and production remains weak after panels clear naturally, it may be time to contact your installer or maintenance provider.
Persistent underperformance after obvious conditions have improved is one of the clearest red flags. For example, if snow has melted, the roof is clean, the days are bright, and output remains noticeably below baseline for weeks, do not ignore it. Homeowners do not need to diagnose the fault themselves. The important step is recognizing that the pattern is no longer explained by normal seasonal context.
Simple Visual Checks You Can Do Safely
Homeowners can do a great deal from the ground and from the app. Safety should always come first. There is rarely a reason to climb onto the roof for routine monitoring. Instead, use binoculars if needed and look for obvious issues such as heavy dirt, leaves gathered along panel edges, broken glass, shifted mounting hardware, nesting activity near wiring, or patches of shade that were not present before.
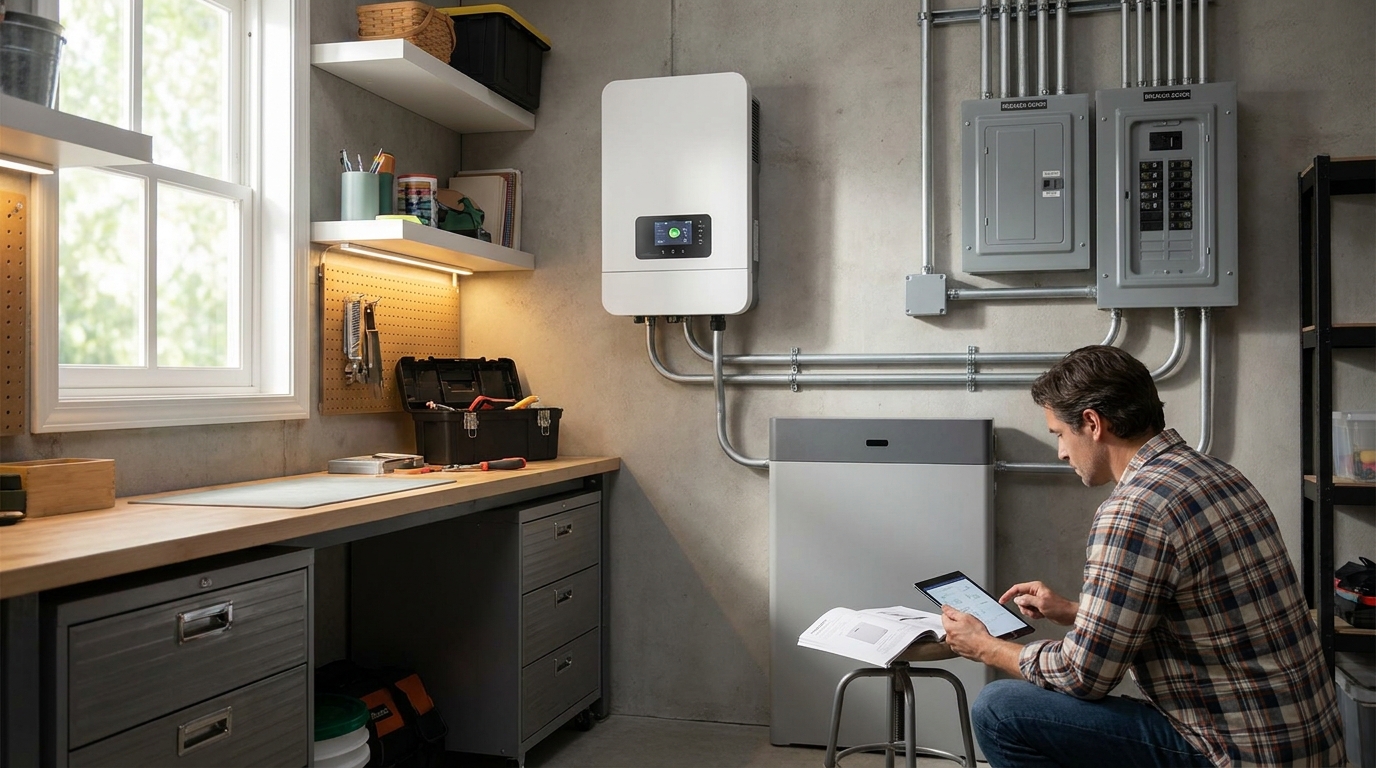
You should also look at the inverter itself if it is accessible. Many residential inverters display a status light or message indicating whether the system is operating, paused, or in fault mode. If you see a warning code, take a photo and compare it with the manual or service portal. A clean photograph is often very helpful when contacting the installer. If your setup includes a battery, glance at its state and any indicators visible in the app or on the equipment panel.
Communication equipment deserves a basic check as well. If your monitoring depends on Wi Fi or a gateway device, make sure your home network has not changed in a way that disconnected reporting. Sometimes what appears to be a performance problem is simply missing data. That is inconvenient, but it is very different from a hardware failure, and the solution may be much simpler.
Panels Are Only Part of the Story
It is natural to think of solar performance as a panel issue, but much of what homeowners notice in practice is linked to other parts of the system. The inverter is especially important because it is the device translating DC electricity from the modules into usable AC power. If the inverter is offline, derated, or faulting intermittently, production can drop even when the roof array itself is in fine condition. That is why inverter health is one of the most useful things to monitor.
Wiring and connections matter too, though those are generally not things homeowners should inspect beyond obvious visual concerns. A professional may investigate string performance, voltage, current behavior, or connector issues if output declines in a way that the app suggests but cannot fully explain. Module temperature also affects production. On very hot days, output may fall below what people expect from the brightness alone. This is normal physics, not necessarily a defect.
If your system includes battery storage, battery behavior becomes part of the monitoring picture. You may want to know when the battery charges, when it discharges, whether it is reserving backup energy correctly, and whether solar production is being stored or exported as intended. Batteries can make dashboards more complex, but they can also make your energy picture more understandable once you get used to the flow.
Professionals sometimes use advanced data such as plane of array irradiance, module temperature, and rated DC power to compare actual versus expected performance. NRCan’s PV Perform Mod is one example of software that analyzes these inputs to detect faults and evaluate system behavior. Homeowners do not need to run such analysis themselves to benefit from the idea behind it. The practical lesson is that a weak looking output number only becomes meaningful when it is compared against the conditions the system was operating under.
How to Compare Actual Production With Expected Production
Many installers provide an estimated annual production figure before installation. This is a useful starting point, but it should not be treated as a rigid guarantee for every month. The estimate is based on assumptions about weather, irradiance, orientation, temperature, and system losses. Real life will never follow the model exactly. The value of the estimate is that it gives you a frame of reference for broad performance, especially over seasonal and annual periods.
A practical homeowner method is to compare your app’s monthly totals with your expected pattern and with prior years. If your home has whole house monitoring, compare solar output with imported grid electricity and exported electricity over the same period. Did solar generation fall while utility purchases unexpectedly rose. Did the system stop exporting at midday when it usually does. Those relationships can reveal changes more clearly than looking at one chart in isolation.
You can also use your utility bills as a reality check. Bills are not a perfect diagnostic tool because rates, usage habits, and weather all affect them, but they are still valuable. If your solar dashboard claims healthy production while your bills rise sharply despite similar household behavior, it is worth digging deeper. Conversely, if production appears slightly lower than expected but your annual grid purchases remain close to normal, the variation may simply reflect weather or seasonal differences.
For homeowners who want one guiding principle, use this: compare similar periods under similar conditions, and pay more attention to trends than to isolated moments. This approach is far more effective than trying to judge your system by whether a single noon peak looked impressive on one particular day.
Weather, Snow, and Seasonal Reality in Canada and Northern Climates
In Canada and across much of North America, weather interpretation is a major part of solar monitoring. Winter output is usually lower because days are shorter and the sun angle is lower. Snow cover can temporarily block production, and that is not inherently a maintenance failure. Often the panels will shed snow naturally as conditions change. In some cases, however, lingering snow on part of an array can create a more uneven recovery pattern that is worth watching over several days.
Cold air itself is not bad for solar production. In fact, modules often perform efficiently in cooler temperatures when sunlight is available. The issue is usually reduced irradiance, snow cover, or lower daylight hours rather than cold alone. This distinction helps explain why a bright clear winter day can still produce a respectable spike even if total daily output remains lower than in summer.
Extreme weather is also becoming a more important monitoring concern. Strong wind, hail, wildfire smoke, heavy pollen events, and unusually persistent heat can all affect system behavior or visibility into expected performance. As fleet scale analytics improve, more systems are being monitored with automated fault detection behind the scenes. For homeowners, the encouraging trend is that dashboards are becoming simpler on the surface while professional diagnostics become more sophisticated in the background.
When to Clean Panels and When to Call a Professional
Panel cleaning is one of the most frequently asked questions in solar maintenance, and the answer depends heavily on local conditions. In many regions, rain handles a fair amount of natural cleaning. In dry dusty climates, near construction, under trees, or in areas with significant pollen and bird activity, soiling may become more meaningful. Monitoring helps here because you can observe whether production recovers after natural cleaning from rainfall or continues to lag.
If you suspect soiling is affecting output, begin with observation rather than immediate action. Are the panels visibly dirty from the ground. Is the underperformance sustained over multiple clear periods. Has shading or debris changed. If cleaning is needed, always follow manufacturer guidance and safety best practices. For many homeowners, professional cleaning is the better choice, particularly for steep roofs or difficult access.
Call your installer or a qualified technician when underperformance persists without an obvious weather explanation, when the inverter shows recurring faults, when app communication outages continue after network checks, or when you see physical damage. It is also wise to call if one section of the system appears to behave differently and the dashboard supports that concern. Good monitoring does not replace professional service. It makes service more timely and more informed.
A Simple Monthly Solar Monitoring Routine
If you want a practical system you can actually maintain, a monthly routine is often the sweet spot. This routine should be brief enough to repeat and detailed enough to be useful. Consider the following approach:
- Open your inverter app or portal and review the monthly production total.
- Compare that total with the same month last year if data is available.
- Note any inverter warnings, communication dropouts, or unusual battery behavior.
- Check whether household consumption or grid import changed unusually relative to production.
- Do a quick visual look from the ground for shade, dirt, snow, or visible damage.
- Record anything notable in a simple note on your phone or calendar.
This routine takes only a few minutes, but it creates continuity. Over time, continuity is what turns isolated numbers into an understandable story about system health. That story is far more useful than trying to remember whether one random week last spring felt more productive than this one.
How Monitoring Protects Long Term Value
Solar monitoring is sometimes framed as a technical hobby, but in reality it is a form of sensible home stewardship. It helps protect equipment life by flagging faults earlier. It supports return on investment by reducing the chance of unnoticed underperformance. It also makes the sustainable value of your home more tangible. When you can see production patterns, understand consumption, and explain the system’s behavior clearly, solar becomes a lived asset rather than an abstract green feature.
This is especially relevant as homes become more electrified. Heat pumps, electric vehicles, batteries, and smart energy management systems all increase the value of knowing how electricity is produced and used on site. Monitoring creates the foundation for those decisions. It shows you when your home is generating abundant power, when you rely on the grid, and where future efficiency improvements might have the greatest impact.
Canadian guidance already recognizes the importance of monitoring in some higher performance housing contexts, including certain Net Zero Home programs. That reflects a broader shift in residential energy design. Homes are becoming more measurable, more data informed, and more capable of self management. Fortunately, the tools are also becoming easier for ordinary homeowners to use.
Final Thoughts: Keep It Simple, Stay Consistent
The most effective way to monitor your solar system is not to become an expert in every technical metric. It is to build a calm, consistent habit around the few signals that matter most. Use your app or inverter portal. Establish a monthly baseline. Compare similar periods rather than reacting to every daily change. Learn what normal seasonal variation looks like in your climate. And pay attention to sudden or persistent drops that do not fit the usual pattern.
Remember that a small year to year decline in output is normal. NREL research suggests that the median performance loss rate is modest, around 0.75 percent per year, and most systems lose less than 2 percent annually. That is not a reason for concern by itself. What deserves attention is a sharper change in production, repeated fault messages, availability problems, or underperformance that continues after weather related explanations have passed.
Perhaps most importantly, monitoring should leave you feeling more empowered, not more anxious. A well functioning solar system does not need constant supervision. It simply benefits from informed ownership. With a few practical checks and a bit of context, you can take charge of your solar system’s performance, protect your investment, and enjoy the quiet confidence that comes from understanding how your home is working for you every day.


No Comment! Be the first one.