


Sustainability metrics are often treated like a technical side note in city planning, but they are actually the operating system behind better urban decisions. If a city says it wants to be greener, healthier, more resilient, or more livable, those ideas only become useful when they are translated into indicators that can be measured over time. That is why sustainability metrics matter to more than policy analysts. They matter to planners deciding where to invest, to residents trying to understand whether life is improving in their neighborhood, and to technology teams building the dashboards that make urban systems visible.
Table Of Content
- Why sustainability metrics matter in cities
- The core categories of urban sustainability metrics
- Greenhouse gas emissions
- Transport and mobility
- Building energy performance
- Water use and reliability
- Waste and circularity
- Air quality, green space, and urban ecology
- Land-use efficiency and sprawl
- Equity and access
- How global frameworks are changing city measurement
- What residents should pay attention to first
- How planners and city teams can build better metric systems
- Common mistakes that make sustainability metrics misleading
- The rise of resilience metrics alongside carbon metrics
- How sustainability metrics improve everyday urban living
- A simple framework for choosing the right metrics
- The future of sustainability metrics in urban intelligence
- Final thoughts
For urban innovators, the real value of sustainability metrics is practical. Good metrics help cities prioritize transit upgrades instead of vague mobility promises. They help identify buildings that consume too much energy instead of assuming all new development is efficient. They help reveal whether a neighborhood has enough shade, enough park access, enough waste diversion options, and enough resilience to cope with heat or flooding. When metrics are built well, they support action. When they are built poorly, they become branding.
North American cities are in a particularly strong position to use these indicators well because much of the required data already exists. Utilities hold billing records that can inform building energy trends. Transit agencies track ridership and service levels. Waste haulers, environmental monitoring programs, and permitting systems produce useful administrative data. At the same time, global frameworks such as UN-Habitat’s Global Urban Monitoring Framework are pushing cities toward more standardized indicators that can be compared across time and across places while still being adapted to local needs.
This article explains how sustainability metrics work, which indicators matter most in urban environments, where the biggest measurement pitfalls appear, and how planners, residents, and technology enthusiasts can turn city data into smarter, greener urban living. The goal is not to create a single score for sustainability. The goal is to build a decision-ready view of how a city functions and where it can improve.
Key idea: Sustainability metrics are the specific, measurable indicators cities use to track whether policies are actually making urban life greener, healthier, and more resilient. They typically span eight core categories: greenhouse gas emissions, transport and mobility, building energy performance, water use and reliability, waste and circularity, air quality and green space, land-use efficiency, and equity and access. A single indicator, such as annual emissions or transit mode share, only becomes useful when it is tied to four things: a clear city goal, a measurable baseline, a regular refresh schedule, and a real policy decision it is meant to inform. Without that chain, even a well-designed dashboard risks becoming decorative rather than operational. For urban innovators, planners, and residents alike, the value of sustainability metrics lies not in producing a single sustainability score, but in building a decision-ready view of how a city actually functions and where it still needs to improve.
Why sustainability metrics matter in cities
Cities concentrate people, buildings, transport systems, services, and infrastructure in a relatively small area, which means small changes in urban systems can have large effects. A transit improvement that shifts travel behavior by a few percentage points can reduce congestion, emissions, commute stress, and household transport costs at the same time. A building retrofit program can lower energy demand, improve indoor comfort, and reduce peak grid pressure. A tree canopy strategy can cool streets, improve mental well-being, and reduce heat vulnerability. Urban sustainability is not one outcome. It is a set of connected outcomes, and metrics are what reveal those relationships.
UN-Habitat’s urban monitoring work has made this point clearly for years. A large share of global development indicators has an urban component, and SDG 11 is directly focused on cities and human settlements. That means local governments are not just implementing environmental policy in isolation. They are balancing housing, transport, public health, resilience, inclusion, and land use in the same space. Sustainability metrics give that balancing act structure.
For Canadian readers, this is especially relevant because national emissions data already highlights the sectors that cities can influence. Canada’s official 2024 greenhouse gas inventory reported 685 Mt CO2e excluding LULUCF, about 10 percent below 2005 levels. Transportation remains one of the largest contributing sectors, and buildings and waste are major urban-relevant sources as well. In other words, the city scale is not marginal to climate action. It is central to it.
The lesson for urban innovators is straightforward. If emissions, mobility, waste, housing access, and resilience are all intertwined, then urban performance should be measured as a system. A city that improves one metric while weakening another is not necessarily becoming more sustainable. That is why a mature sustainability strategy looks less like a single score and more like a balanced set of indicators with clear tradeoffs.

The core categories of urban sustainability metrics
The most useful sustainability metrics tend to cluster into a handful of categories. These categories reflect the main systems that shape urban life and also align well with the data cities already collect. While every city will adapt indicators to local context, the broad structure is fairly consistent across successful frameworks.
Greenhouse gas emissions
Emissions remain a core category because they provide a direct link between local action and climate impact. At the city level, this usually includes community-wide emissions by sector such as transportation, buildings, waste, and sometimes industry. The most useful reporting separates these sectors clearly rather than merging them into one total. That allows decision-makers to see where change is actually happening.
In Canada, transportation accounted for 23 percent of total greenhouse gas emissions in 2023, equal to 157 Mt CO2e. That fact alone makes mobility metrics essential for urban sustainability planning. A city can say it supports climate action, but if vehicle dependence keeps rising, the data will expose that contradiction. Emissions metrics should therefore be paired with transport indicators that explain why the emissions trend looks the way it does.
Transport and mobility
Mobility metrics are among the most visible to residents because they affect daily routine. The strongest indicators include commute time, mode share, transit access, walkability, cycling access, and the proximity of housing to jobs and services. These are not just convenience metrics. They shape carbon outcomes, road safety, household costs, land-use efficiency, and social inclusion.
Mode share is especially powerful because it captures how a city is functioning rather than how it imagines itself. If public transit, walking, and cycling remain low even in dense areas, something in the urban system is broken. That could be poor service frequency, unsafe street design, disconnected land uses, or high housing costs pushing workers far from employment centers. A simple transport metric often points toward several underlying policy failures at once.
Building energy performance
Buildings are another foundational category because they are long-lived assets and major energy users. Useful building metrics include energy use intensity, retrofit rates, electrification progress, heating fuel mix, and operational emissions by building type. For residents, these indicators connect directly to utility bills, comfort, and indoor health. For planners and property owners, they reveal where policy, incentives, and codes can produce durable gains.
It is also important to distinguish between new construction and the existing building stock. Many cities focus communication on high-performance new developments while most emissions continue coming from older homes and commercial properties. A city that tracks permit counts but not actual building performance may overestimate progress. Good metrics close that gap by measuring how buildings operate, not just how they were designed on paper.
Water use and reliability
Water is often under-discussed in urban sustainability conversations, yet it is fundamental to resilience and quality of life. Urban water metrics can include per capita water consumption, leakage rates, wastewater treatment performance, stormwater capture, and service reliability. In some regions, drought stress makes water efficiency central. In others, intense rainfall and aging infrastructure make stormwater management the larger issue.
The key analytical point is that water metrics should not sit in isolation. They interact with land cover, building design, green infrastructure, and climate risk. A city that reduces water use but remains highly exposed to runoff and flood damage is not fully managing the system. That is why integrated metrics matter more than siloed reporting.
Waste and circularity
Waste metrics are more useful than many people assume because they reveal both environmental performance and service design. Municipal solid waste statistics are already tracked through Statistics Canada surveys and federal indicators, making diversion and disposal measurable at municipal and provincial levels. Core indicators include waste generation per capita, diversion rate, organics capture, landfill disposal, and methane-related emissions where data allows.
Residents feel waste systems immediately. If diversion is confusing, inaccessible, or inconsistent across neighborhoods, participation falls. In that sense, a waste metric is also a convenience and equity metric. It reflects whether sustainable behavior is easy enough to become normal.
Air quality, green space, and urban ecology
Not all sustainability benefits are captured by carbon accounting. Air quality metrics such as particulate matter, nitrogen dioxide, and ozone matter because they link environmental performance to respiratory health and daily experience. Green space access, tree canopy, and biodiversity indicators matter because they shape heat exposure, recreation, stormwater absorption, and neighborhood well-being. These metrics are often where residents most clearly feel the difference between a merely dense city and a truly livable one.
Tree canopy is a good example of a metric that combines environmental and social value. It can reduce local heat, improve visual quality, absorb some pollution, and contribute to mental restoration. Yet canopy is not evenly distributed across cities. Measuring it at the neighborhood scale can reveal inequities that a citywide average hides.
Land-use efficiency and sprawl
Land-use metrics help cities understand whether growth patterns are efficient or expensive. UN-Habitat has noted that urban sprawl in the United States adds around US$400 billion per year in infrastructure, public service delivery, and transport costs. Indicators in this category can include density, land consumption rate, jobs-housing balance, infill development share, and access to services within a walkable catchment.
Density by itself is not the answer, and this is where many conversations become simplistic. Density can reduce land consumption and transport emissions, but only if it is paired with transit, mixed use, public amenities, and affordability. Otherwise, a city may gain units while worsening congestion or pushing lower-income households farther away. Land-use metrics work best when they are linked to mobility and equity metrics rather than treated as a separate planning exercise.
Equity and access
Equity indicators are essential because average city performance can hide deep neighborhood gaps. Common measures include transit access, park access, heat vulnerability, exposure to pollution, housing cost burden, and proximity to jobs and essential services. These metrics ask a crucial question: who benefits from sustainability improvements, and who is still underserved?
A city can look strong on aggregate emissions while low-income households face long commutes, poor air quality, or inadequate cooling during heat events. If those conditions are invisible in the dashboard, the sustainability strategy is incomplete. Equity metrics are not a secondary add-on. They are what make sustainability real at the resident level.
How global frameworks are changing city measurement
One of the most important developments in recent years is the move toward more standardized urban measurement. UN-Habitat’s Global Urban Monitoring Framework, endorsed by the UN Statistical Commission in March 2022, was designed to improve comparability across functional urban areas. This matters because traditional municipal boundaries often fail to capture how cities actually work. Jobs, commuting patterns, housing markets, freight movement, and resource flows regularly cross jurisdictional lines.
Functional urban areas are a better lens because they reflect the real economic and social footprint of a city. A downtown core may appear efficient if measured alone, but its performance can look very different once the wider commuter shed is included. The same issue appears in waste, emissions, and housing access. Boundary choice is not a technical footnote. It can change the story a metric tells.
UN-Habitat’s City Prosperity Initiative also reinforces the need for breadth. It uses more than 100 indicators across six dimensions, including environmental sustainability, governance, and quality of life. The signal here is important. Cities are moving away from isolated environmental scorecards and toward interoperable systems that connect sustainability to urban prosperity, inclusion, and resilience.
For North American readers, this trend means sustainability metrics are increasingly tied to open data, geospatial analysis, and digital observatories rather than annual reporting alone. A static PDF report still has value, but the more powerful model is an updateable dashboard that combines maps, trends, and neighborhood comparisons. That is the intelligence layer modern urban governance needs.
What residents should pay attention to first
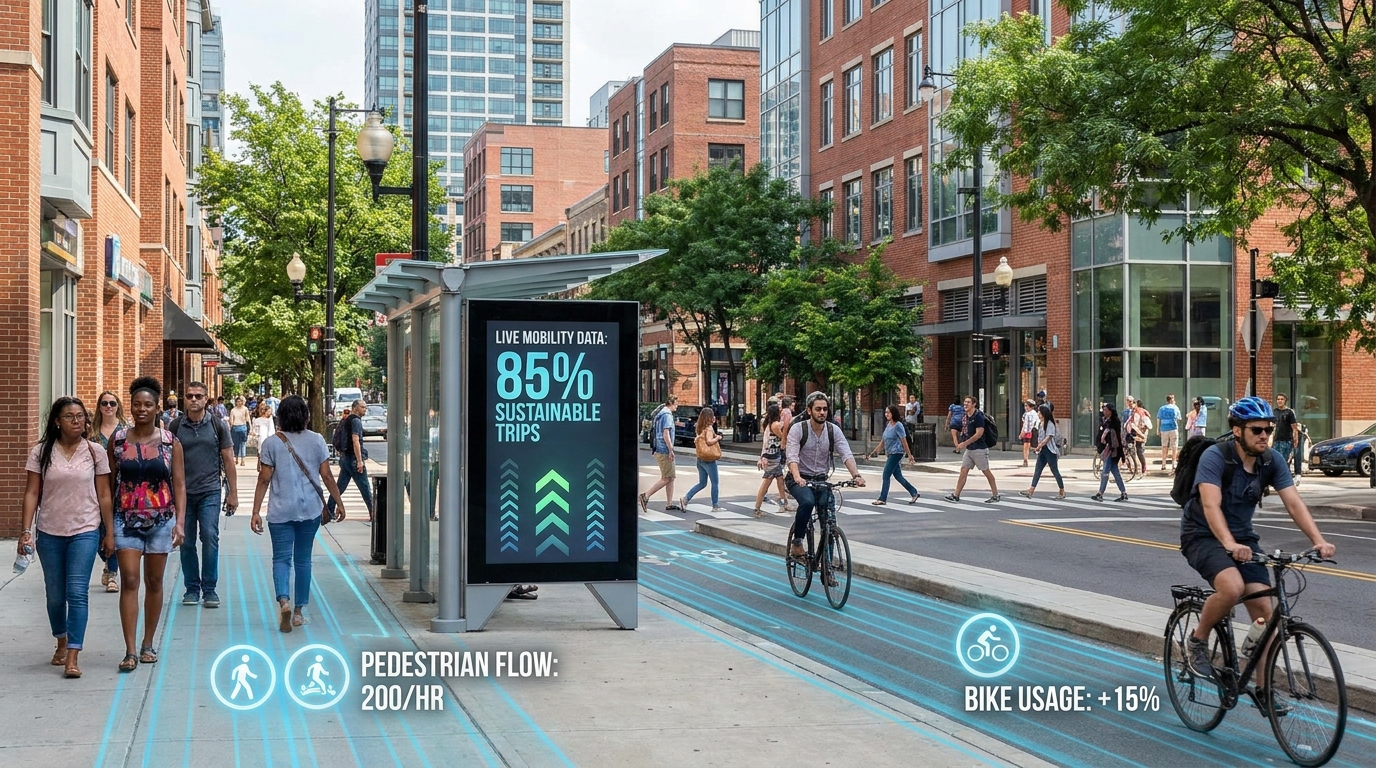
Residents do not need to become data scientists to use sustainability metrics intelligently. In fact, the most meaningful urban indicators are often the ones people can feel every day. Commute time, transit reliability, safe walking access, housing proximity to services, air quality, tree shade, park access, and waste diversion convenience all directly shape quality of life. These are practical signals of whether a city is delivering sustainability where it counts.
If you are assessing your own neighborhood, start by asking simple but revealing questions. Can most daily errands be done without a car. Is there frequent transit within a comfortable walking distance. Do summer heat conditions feel noticeably harsher on some blocks than others. Are waste and organics services easy to use in multi-unit housing. Can children and older adults move through the area safely. Each of these questions can be linked back to a measurable indicator.
Residents should also be cautious about citywide averages. A municipality may advertise expanding green space while your district has little shade and poor park access. It may celebrate transit ridership growth while your route remains unreliable. Neighborhood-scale metrics matter because urban life is local. The average city resident does not exist. There are only residents in specific places, with specific constraints, interacting with the city in real time.
For tech enthusiasts, this is where mapping and open data become powerful. Public datasets can often be layered to reveal useful patterns such as where energy burden overlaps with older housing stock, or where heat vulnerability overlaps with limited canopy and low transit access. The most valuable urban intelligence often comes not from one indicator, but from seeing where several weak signals coincide.
How planners and city teams can build better metric systems
The strongest sustainability metric systems are not the ones with the most indicators. They are the ones with the clearest structure. Every metric should have a defined boundary, a baseline year, a refresh cadence, a target, and a decision use-case. If any of those elements is missing, the metric is at risk of becoming informational rather than operational.
A practical approach is to design metrics around decisions that city teams already need to make. For example, a transport department deciding where to prioritize bus lanes needs indicators related to travel time reliability, ridership potential, equity, safety, and corridor emissions. A housing and planning department deciding where to upzone needs indicators related to jobs-housing balance, transit access, park capacity, affordability, and infrastructure readiness. The point is to make metrics answer real questions, not abstract ones.
It also helps to separate indicators into a few tiers. One tier can include citywide headline indicators for public transparency. A second tier can include operational metrics for departments. A third can include neighborhood diagnostics that reveal local conditions and equity concerns. This keeps the public narrative simple while preserving analytical depth inside the administration.
Data integration is another major opportunity. Utility data, sensor data, census data, permits, environmental monitoring, and service records often sit in separate silos. Yet sustainability challenges rarely respect those silos. Building performance affects emissions and affordability. Street trees affect heat, drainage, and public health. Transit access affects mobility, employment access, and land-use efficiency. The more cities can responsibly integrate these datasets, the more useful their metrics become.
- Define the boundary clearly. Decide whether the metric applies to a municipality, a neighborhood, or a functional urban area.
- Set a baseline. Without a starting point, improvement cannot be measured credibly.
- Choose a refresh rhythm. Some indicators should update monthly, others annually, but the schedule should be intentional.
- Tie each metric to a target. A number without a destination rarely drives action.
- Link the metric to a decision. Every indicator should help allocate money, shape policy, or inform the public.
This kind of discipline turns dashboards from passive display tools into governance tools. It also builds trust, because residents can see not only what is being measured, but why.
Common mistakes that make sustainability metrics misleading
One of the biggest mistakes in urban sustainability reporting is mixing unlike units into a composite score without explaining the weighting. A city may receive a high overall ranking even if it performs poorly on affordability, resilience, or environmental justice. Composite indices can be useful for communication, but they should never hide the underlying sub-metrics. If the score is easier to understand than the reality, that is a warning sign.
Another common issue is relying on national or provincial averages instead of city-specific data. National data helps provide context, but local planning decisions require local signals. A city with strong transit use, a hydro-dominant grid, and compact development has a very different emissions profile from one with auto dependence and sprawling land use. Using broad averages can flatten those differences and lead to bad policy assumptions.
Boundary effects are another serious challenge. Cities import food, materials, consumer goods, and energy, and they often export waste beyond their borders. Residents may also live in one municipality and work in another. If a city ignores these flows, its metrics can look cleaner than reality. This does not mean every dashboard needs a full consumption-based accounting system, but it does mean boundary choices should be stated openly and interpreted carefully.
There is also a tendency to over-focus on carbon while neglecting adaptation and resilience. Emissions matter deeply, but so do flood exposure, heat vulnerability, infrastructure redundancy, water reliability, and emergency readiness. A city can reduce operational emissions and still be dangerously unprepared for climate shocks. The strongest sustainability frameworks treat mitigation and resilience as parallel priorities, not competing ones.
Finally, more data does not automatically improve decision-making. Cities can collect huge volumes of information without clarifying what each metric is for. A well-designed indicator with a clear target is more valuable than ten loosely defined ones. Precision is not just about measurement quality. It is about decision relevance.
The rise of resilience metrics alongside carbon metrics
Urban sustainability is changing shape. A decade ago, many city strategies were dominated by carbon reduction goals. Today, resilience metrics are gaining deserved attention because climate risk is no longer theoretical. Heat waves, smoke events, flooding, and infrastructure disruption are affecting urban life directly. That means sustainability measurement must include not only how cities reduce harm, but how they absorb and adapt to it.
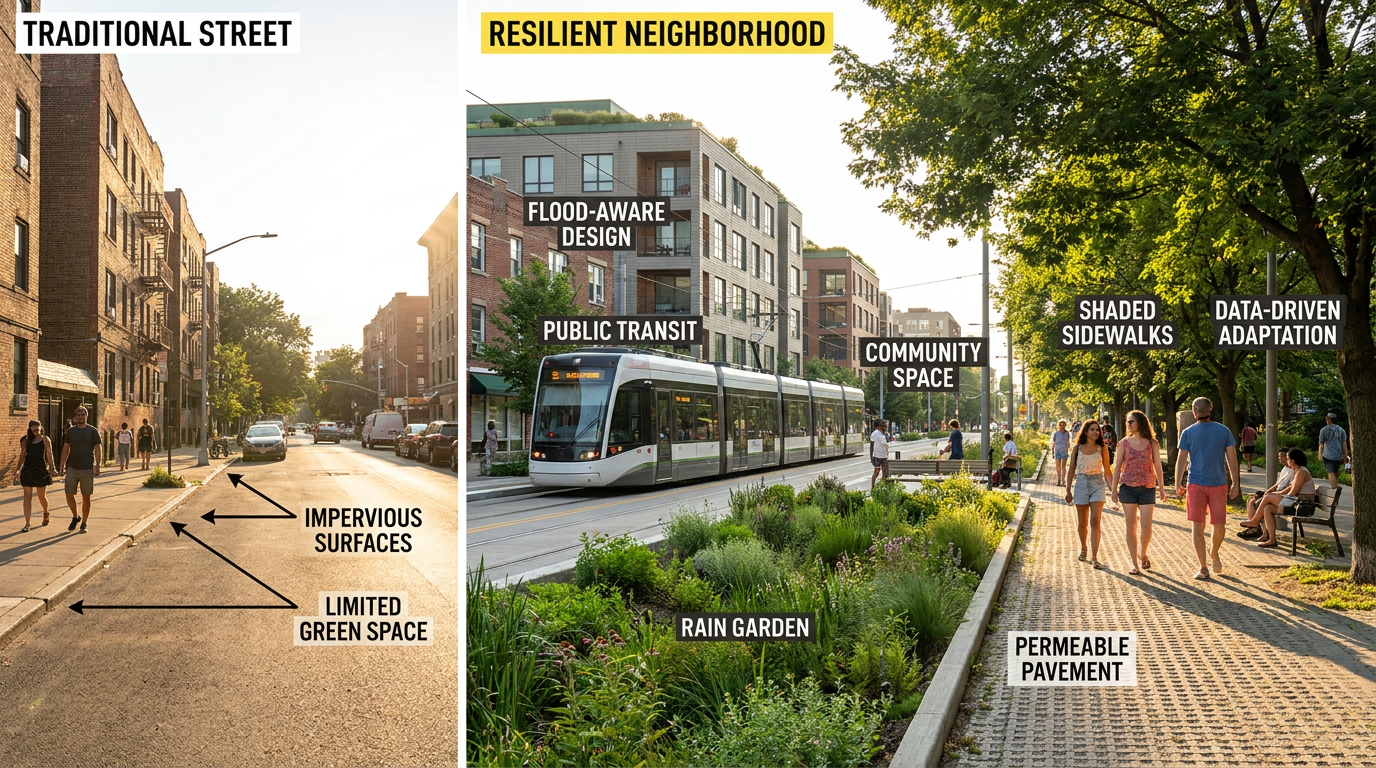
Useful resilience indicators include the share of residents exposed to extreme heat, the percentage of impervious land in flood-prone zones, the number of critical facilities with backup power, infrastructure redundancy across water and transport networks, and access to cooling centers or shaded public space. These are not fringe concerns. They are rapidly becoming core urban performance indicators.
Resilience metrics are especially powerful when they are spatial. A citywide heat average is less useful than a map showing where heat islands overlap with low-income populations, older housing, and weak tree canopy. The same is true for flood risk. Mapping where infrastructure vulnerability intersects with housing and mobility patterns gives planners a far better basis for prioritizing investment.
This is also where green infrastructure becomes measurable rather than aspirational. Rain gardens, bioswales, permeable surfaces, and urban forests can all be connected to outcomes such as runoff reduction, surface cooling, and public amenity access. When cities quantify those benefits, green infrastructure competes more effectively for funding because it can be evaluated alongside gray infrastructure instead of being treated as aesthetic enhancement.
How sustainability metrics improve everyday urban living
For many people, sustainability still sounds abstract until they see how metrics influence ordinary urban life. Consider housing near transit. If a city tracks the share of homes within easy access of frequent transit and essential services, it can encourage development patterns that reduce commute costs and travel time. That affects budgets, stress, and lifestyle as much as emissions.
Consider building energy performance. Better measurement can support retrofit programs that lower bills, improve comfort in winter and summer, and reduce mold or ventilation issues. The result is not just carbon reduction. It is a healthier and more affordable home environment. The same pattern appears across other categories. Better waste metrics can lead to simpler recycling and organics systems. Better air quality monitoring can shape traffic management and school siting. Better heat metrics can direct tree planting to the blocks that need it most.
There is also a democratic benefit. Public dashboards can improve transparency if they are designed well. Residents can see whether promises are translating into outcomes and whether improvements are distributed fairly. This shifts sustainability from a branding exercise to a shared accountability framework. It also invites civic participation because people understand what is being measured and how their neighborhood compares.
For innovators in property technology, mobility analytics, and civic technology, this creates new opportunities. The future of urban intelligence is not just collecting data. It is translating city signals into practical insight for investment, design, operations, and public service delivery. Sustainability metrics are one of the clearest places where that intelligence layer can create real value.
A simple framework for choosing the right metrics
If you are building or evaluating a sustainability dashboard, a simple framework can help. Start by asking what urban outcome you care about most. Is it lower emissions, better access, higher resilience, lower waste, improved affordability, or stronger public health. Then identify the system that influences that outcome, such as mobility, buildings, land use, or infrastructure. Only after that should you choose the metric.
Next, test whether the metric passes four practical checks. Is it understandable to non-specialists. Is it updated often enough to inform action. Is it specific to the relevant geography. Does it connect to a policy lever someone can actually use. If the answer to any of these is no, the indicator may still be interesting, but it is probably not decision-ready.
It is also wise to pair leading and lagging indicators. A lagging indicator tells you what has already happened, such as total annual emissions. A leading indicator suggests what is likely to happen next, such as transit service expansion, retrofit permit volume, or the share of homes being built near rapid transit. Cities need both. Lagging indicators confirm results. Leading indicators help shape them.
Finally, avoid the temptation to reduce sustainability to a single score. Urban systems are too complex for one number to tell the whole story. A balanced dashboard with clear tradeoffs is more honest and more useful than a neat ranking that oversimplifies reality.
The future of sustainability metrics in urban intelligence
The direction of travel is clear. Sustainability metrics are becoming more standardized, more geospatial, more open, and more integrated with real-time urban management. Cities are moving from occasional reporting to living data systems. Sensors, satellite imagery, utility feeds, administrative records, and census data are increasingly being combined to support neighborhood-scale decision-making.
This does not mean every city needs a flashy smart city platform. In many cases, the smartest move is simply to improve the consistency, transparency, and usefulness of the data already being collected. A well-maintained set of indicators aligned to clear decisions can outperform an expensive platform with no governance logic behind it. Good urban intelligence is less about technological spectacle and more about analytical discipline.
For Canada and the broader North American context, the ingredients are already there. Federal environmental indicators, transport reporting, emissions inventories, waste statistics, and local open data portals provide a strong base for city scorecards that are both locally relevant and aligned with global frameworks. The challenge now is not whether to measure sustainability. It is whether cities can measure it in ways that truly improve urban life.
That is the real promise of sustainability metrics. They help cities see themselves more clearly. They show where policy is working, where tradeoffs are appearing, and where residents are still being left out of progress. For urban innovators, that clarity is not optional. It is the starting point for building cities that are not only greener on paper, but smarter, fairer, and better to live in every day.
Final thoughts
Understanding sustainability metrics means understanding how cities translate values into action. The best indicators are not abstract scorekeeping tools. They are practical guides for investment, design, accountability, and neighborhood improvement. They help connect climate goals to bus lanes, retrofit programs, tree planting, waste systems, flood planning, and housing location choices.
If you are a planner, use metrics to prioritize and explain tradeoffs honestly. If you are a resident, focus on the indicators that affect your daily experience and ask for neighborhood-level transparency. If you are a technologist, build tools that make city data more useful, not just more abundant. Across all three roles, the principle is the same. Measure what matters, define it clearly, and connect it to decisions that improve urban living.
That is how sustainability stops being a slogan and becomes a working urban system.



No Comment! Be the first one.