


Real estate development has always involved judgment, timing, and risk. What has changed is the volume of data now available to test those judgments before capital is committed. In today’s market, investors can no longer rely on a simple equation of buying land in a growing city and assuming the project will work. Interest rates, construction pricing, zoning complexity, labor shortages, infrastructure constraints, and climate exposure now shape returns just as much as location itself. That is why development analytics has become one of the most practical tools in modern real estate investing.
Table Of Content
- Why development analytics matters more now
- What development analytics actually includes
- Start with demand, but do not stop there
- Population growth and household formation
- Employment, wages, and affordability
- Rents, vacancy, and absorption
- Supply pipeline analysis is where many deals are won or lost
- Zoning, entitlement, and land-use constraints are not footnotes
- Infrastructure readiness matters
- Climate risk has moved into the investment core
- The spread between cost and value is where the decision happens
- Scenario underwriting is no longer optional
- How modern investors are using AI and automation
- Building a repeatable development analytics workflow
- What investors often get wrong
- Where opportunity is strongest now
- A practical framework for evaluating one site
- Development analytics as a strategic advantage
At its core, development analytics is the disciplined use of data to evaluate whether a site should be developed, what should be built, how quickly it can be delivered, and what returns are realistic under changing conditions. It combines market demand, supply pipeline analysis, entitlement risk, financial modeling, and site-specific constraints into one decision framework. For investors, this means moving beyond broad market headlines and toward a more precise understanding of how one parcel, one submarket, and one product type may perform.
The timing could not be more relevant. CMHC reported that Canada’s housing starts rose 6% in 2025, with record rental and missing-middle construction helping drive supply growth. At the same time, CMHC estimated that restoring housing affordability to 2019 levels would require roughly 430,000 to 480,000 new housing units per year over the next decade. That gap tells a clear story. There is a deep structural need for housing, but not every proposed project will succeed equally. Investors who can identify the right locations, the right product, and the right capital structure stand to benefit most.
This guide explains how development analytics works in practice, what data matters most, and how investors can build a repeatable process for evaluating opportunities. The goal is not to make development look simple. It is to make complex decisions more legible, more testable, and more actionable.
Key idea: Development analytics is not just market research. It is the intelligence layer that connects demand, supply, zoning, financing, and site conditions into a workable investment decision.
Why development analytics matters more now
In lower-volatility periods, real estate investors could sometimes absorb a weak assumption or two and still reach acceptable returns. In a tighter environment, small errors compound quickly. A modest delay in permitting can increase carrying costs. A rent growth assumption copied from a metro-wide report can overstate revenue in a submarket facing heavy new deliveries. A site that looks attractive on a map may prove far less efficient once parking minimums, setbacks, servicing limitations, and flood exposure are fully understood. Development analytics reduces the chance that these issues are discovered too late.
Market conditions across Canada and the United States reinforce this need for precision. Freddie Mac’s 2025 multifamily outlook projected rent growth of about 2.2% and vacancy around 6.2%, while noting that higher supply and weaker demand in some areas could pressure rents and values. This is a critical reminder that investors should not underwrite from national averages alone. Real development outcomes are shaped by the exact neighborhood, the immediate pipeline, and the match between local demand and the product being proposed.
The financing environment adds another layer. U.S. Census construction spending data continue to show how large and volatile construction activity remains as a macro factor. In Canada, public financing has become especially important in rental development. CMHC reported that its Apartment Construction Loan Program had committed more than C$29 billion to support more than 74,500 rental homes by the end of 2025. It also estimated that CMHC construction financing supported 88% of Canada’s new purpose-built rental apartment starts in 2024. For investors, that means policy and credit structures are not side notes in the underwriting process. They are often central to feasibility.
Another force reshaping development is regulation. NAHB’s 2026 study estimated that regulation adds about US$131,734 to the cost of a new single-family home. The exact number will vary by market and product type, but the message is broader than any one statistic. Non-market costs, from approvals and fees to code requirements and delays, can materially alter returns. Investors who fail to model them are not being optimistic. They are simply underestimating reality.
What development analytics actually includes
Many people hear the term and assume it means pulling a few demographic charts or reviewing a rent report. In practice, development analytics is much more integrated. It asks a series of connected questions. Is there real demand for the proposed use? How much competing supply is coming? Can the site legally and physically support the intended project? What will it cost to build and finance? How resilient is the asset to climate and regulatory risk? And after all of that, is the spread between cost and value still attractive enough to justify the risk?
The strongest analytics frameworks combine five categories of information. The first is demand-side data, including population growth, household formation, employment, wages, migration, rents, vacancy, absorption, and tenure patterns. The second is supply-side data, such as permits, starts, completions, active proposals, and comparable product deliveries. The third is site and entitlement data, including zoning, allowable density, height limits, setbacks, parking, servicing, topography, environmental issues, and approval history. The fourth is financial data, covering construction costs, debt terms, carry, incentives, taxes, fees, and exit assumptions. The fifth is risk data, especially climate exposure, insurance conditions, labor availability, and macro volatility.
When these inputs are analyzed together, investors gain something far more useful than a generalized market opinion. They get a practical answer to a specific question: Should I pursue this development opportunity, and under what assumptions does it still make sense?

Start with demand, but do not stop there
Every development story begins with demand. If too few people want the product at the target price point, no amount of spreadsheet sophistication will save the deal. Yet this is also where many investors stop too early. A city may be growing overall, but that does not necessarily support every neighborhood, every unit type, or every rent level. Development analytics pushes demand analysis down to the submarket and often to the micro-location.
Population growth and household formation
Population growth remains one of the clearest long-term supports for residential development, but household formation is usually the more actionable metric. Investors should ask not only whether more people are arriving, but whether they are forming new households, what age groups they represent, what income bands they occupy, and whether they are more likely to rent or buy. A market attracting young professionals may support smaller urban apartments. A suburb seeing family formation may support townhomes or missing-middle formats. The same headline growth can imply very different product strategies.
Migration patterns also matter. Domestic outflows from expensive cores can create strength in nearby nodes, while international migration can increase demand for rental housing in gateway and education-linked markets. The lesson is simple. Demand is not just about more people. It is about the composition of those people and the housing choices they are likely to make.
Employment, wages, and affordability
Employment growth is often treated as a positive signal, and in most cases it is. But investors should look carefully at the quality and distribution of that growth. A market adding jobs in high-paying sectors can support more ambitious pricing than a market creating mainly lower-wage service roles. Wage growth, commuting patterns, and employer concentration all influence what households can afford and where they want to live.
Affordability pressure can also redirect demand toward specific formats. In cities where ownership is out of reach for more households, rental demand often deepens. This is one reason purpose-built rental and missing-middle strategies have attracted sustained interest. Supply gaps can create opportunity, but only when the proposed rents align with what the local market can realistically absorb.
Rents, vacancy, and absorption
Rent growth and vacancy rates are among the most quoted metrics in real estate, but they are frequently used too broadly. Freddie Mac’s projection of 2.2% rent growth and 6.2% vacancy in the U.S. multifamily market is useful context, yet no investor should underwrite a deal from that figure alone. What matters is the submarket pipeline, recent lease-up velocity, concessions, and the competitive position of the proposed product.
Absorption tells a particularly important story. A submarket may show healthy headline rents while quietly struggling to absorb a wave of new supply. In that case, a project may still succeed, but only with slower lease-up, more concessions, or lower stabilized pricing. Development analytics helps reveal whether current strength is durable or simply lagging the arrival of new competition.
Supply pipeline analysis is where many deals are won or lost
Investors often underestimate how much future supply matters. Existing vacancy is only one piece of the picture. The more important question is what will be delivered between now and stabilization. A site can look attractive in a low-vacancy market, yet underperform if a large number of similar units arrive before the project leases up. This is why pipeline tracking is essential.
A strong supply analysis considers permits, starts, active construction, proposed projects, likely delivery timing, cancellations, and project segmentation by quality and price point. It also asks whether financing conditions are likely to delay some developments. In markets where debt is harder to secure or construction pricing remains unstable, nominal pipeline volume may overstate actual future competition. On the other hand, markets with strong public support or easier approvals may convert proposed supply into delivered units more efficiently than expected.
This is especially relevant in Canada’s rental market. With CMHC’s financing programs supporting a large share of purpose-built rental starts, investors need to understand where those tools are active and how they influence the competitive field. Public financing can improve feasibility, but it can also increase the number of viable projects competing in the same corridor or submarket. The most informed investors evaluate both sides of that equation.
Zoning, entitlement, and land-use constraints are not footnotes
One of the most expensive misconceptions in development is the belief that land availability equals development potential. A parcel can be well located, reasonably priced, and surrounded by growth, yet still fail as an investment because the entitlement path is too constrained. Development analytics addresses this by treating regulation as a core investment variable rather than an administrative afterthought.
Zoning analysis should begin with the current bylaw, but it should not end there. Investors need to assess allowable density, height, lot coverage, setbacks, parking requirements, unit mix constraints, design review thresholds, development charges, community benefit obligations, and political receptivity. In some cases, the value lies not in as-of-right density but in the probability of successful rezoning or minor variance relief. That probability can be informed by precedent, local planning priorities, election cycles, and the municipality’s stated housing goals.
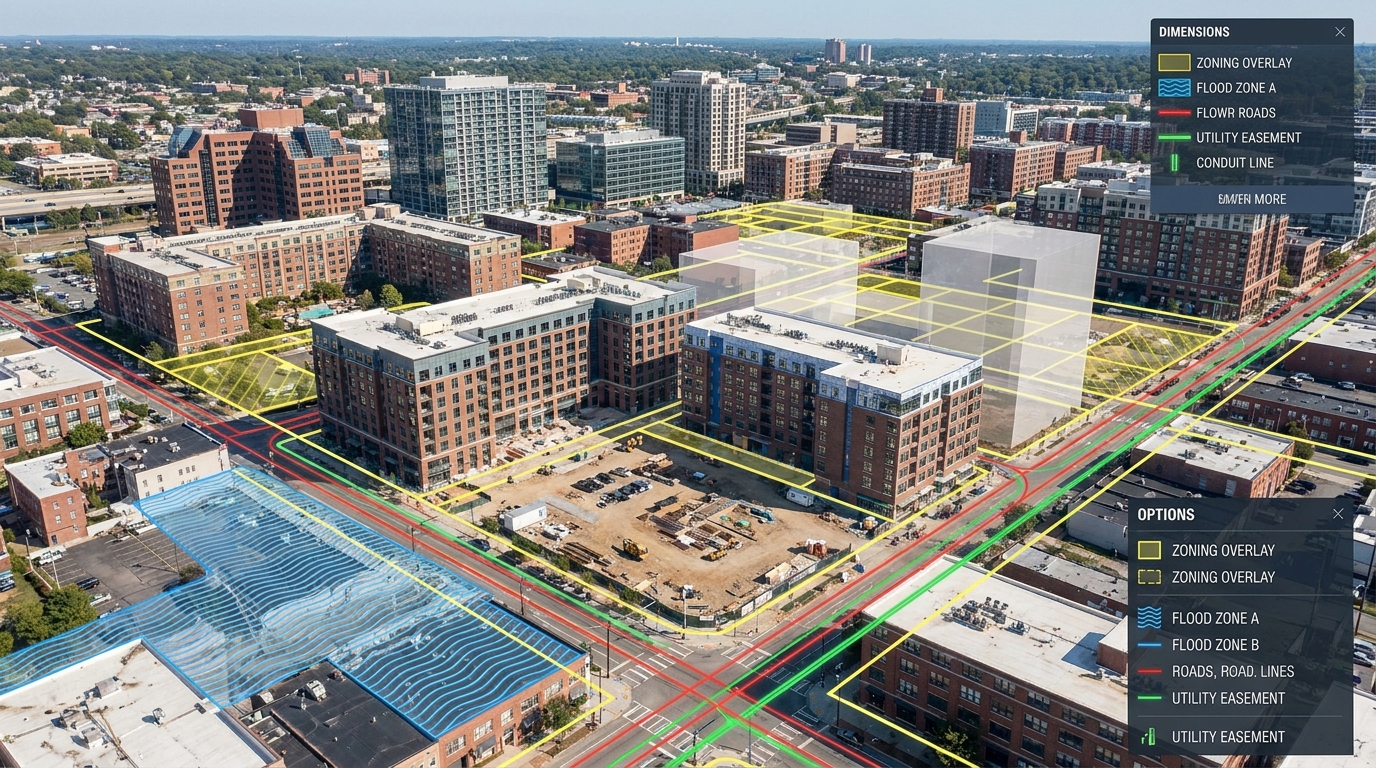
Urban Institute research in 2025 demonstrated how parcel data, zoning rules, flood hazard, and building information can be combined to estimate housing capacity and climate exposure. For investors, that kind of integrated approach is incredibly useful. It turns a vague question like “Can we build here?” into a more precise one: “How much can we build here under current rules, what risks could reduce that capacity, and what is the likely time and cost of securing approvals?”
Infrastructure readiness matters
Buildability is also physical, not just legal. Investors should confirm utility capacity, road access, transit connectivity, stormwater requirements, geotechnical conditions, environmental remediation needs, and off-site improvements. A site may support density on paper but require expensive servicing upgrades that erase the value of that entitlement. In other cases, infrastructure readiness can become a real competitive advantage, especially for infill sites in supply-constrained urban areas.
These are the details that separate sophisticated development analytics from generic site selection. Two parcels in the same district can produce very different outcomes once servicing, grading, remediation, and access are factored into the pro forma. That is why high-level market optimism must always be tested against the physical realities of the site.
Climate risk has moved into the investment core
For many years, climate risk sat at the edge of underwriting. It was viewed mainly as an insurance issue or a distant strategic concern. That is no longer enough. Flood, wildfire, extreme heat, and water management challenges increasingly affect what can be built, how much it costs to insure, how lenders view the asset, and how future buyers price risk. Development analytics now needs a climate layer from the earliest screening stage.
Floodplain maps, wildfire exposure, heat vulnerability, drainage capacity, and resilience requirements should all be considered before land is priced as developable. In some places, climate risk may reduce usable area, add mitigation costs, or slow approvals. In others, it may simply require design changes that modestly affect margins. The key is to quantify these impacts early instead of treating them as a later surprise.
This is one of the clearest examples of why development analytics is broader than standard market research. Climate exposure does not just affect operations after completion. It can change entitlement probability, financing options, cap rates, and long-term asset value before a shovel hits the ground.
The spread between cost and value is where the decision happens
Once demand, supply, and site conditions are reasonably understood, investors still face the most important test of all: does the stabilized value meaningfully exceed total development cost after adjusting for risk? This spread is the financial expression of feasibility. It sounds straightforward, yet it is where assumptions become most fragile.
Total development cost now faces pressure from multiple directions. Land may still be expensive in many growth markets, but it is often no longer the only or even primary challenge. Construction inflation, labor shortages, financing costs, and regulatory burdens have become more decisive. NAHB’s estimate that regulation adds US$131,734 to the cost of a new single-family home is a useful signal of how substantial non-market costs can be. Even if a particular multifamily or mixed-use project differs in structure, the principle remains. Entitlement and compliance costs are large enough to reshape returns.
Investors should build underwriting models that clearly separate hard costs, soft costs, contingency, financing, developer fees, taxes, leasing assumptions, and timing. Too often, weak pro formas collapse costs into broad categories that hide the real risk points. A better model allows each variable to move independently so that sensitivity testing becomes meaningful rather than cosmetic.

Scenario underwriting is no longer optional
In a more uncertain market, a single base-case pro forma is not enough. Investors should test at minimum a downside, base, and upside case. The downside should account for slower absorption, lower rents or sales prices, higher interest carry, and cost overruns. The upside can model stronger lease-up or favorable cap rate movement, but disciplined investors spend most of their attention on resilience rather than optimism.
Important sensitivity variables include exit cap rate, rent growth, occupancy stabilization timing, construction duration, contingency use, debt terms, and approval delays. A project that looks strong in the base case but fails under a modest delay scenario may simply be too fragile for the current cycle. Conversely, a project with moderate returns but strong resilience under stress may be a better investment than a more exciting but highly vulnerable alternative.
How modern investors are using AI and automation
One of the most interesting shifts in development analytics is not just the growth of data, but the speed at which it can now be processed. Investors increasingly use automated zoning extraction, AI-assisted code interpretation, geospatial screening tools, and alternative data sources to compare sites faster. The advantage is not that machines replace judgment. The advantage is that they reduce manual friction and help investors focus judgment where it matters most.
For example, an investor screening dozens of parcels across several municipalities can use automated tools to flag basic zoning fit, lot dimensions, proximity to transit, flood exposure, and surrounding pipeline activity. That does not eliminate the need for legal, planning, or engineering review. It simply narrows attention to the highest-potential sites earlier in the process. In competitive markets, that speed can matter.
AI can also support scenario generation. Rather than manually rebuilding assumptions for every site, investors can use analytics platforms to standardize inputs, compare product types, and update forecasts as conditions change. The most useful systems are not necessarily the flashiest. They are the ones that make underwriting more repeatable, more transparent, and easier to revise as new information arrives.
Practical advantage: The real value of AI in development analytics is faster screening, cleaner comparisons, and more adaptive underwriting. It is not a substitute for local market knowledge or disciplined investment judgment.
Building a repeatable development analytics workflow
The best investors do not reinvent their process for every opportunity. They build a repeatable workflow that improves with each deal. This creates consistency in screening, underwriting, and decision-making, while also making it easier to compare opportunities across locations or asset types. A repeatable workflow also reduces the risk that enthusiasm for a compelling site overrides objective review.
A strong development analytics workflow often follows a sequence like this:
- Market screen: Start with metro and submarket indicators such as population growth, household formation, employment, rent trends, vacancy, and policy support for the relevant product type.
- Pipeline review: Identify current and future competing supply, with attention to delivery timing, unit quality, price positioning, and financing likelihood.
- Site feasibility screen: Review zoning, density, access, servicing, environmental issues, climate exposure, and infrastructure readiness.
- Concept testing: Compare alternative use scenarios such as rental, condo, townhome, mixed-use, or phased development.
- Pro forma underwriting: Build a granular model of hard costs, soft costs, financing, timelines, revenue, and exit assumptions.
- Sensitivity analysis: Test downside cases for costs, rents, absorption, cap rates, and delays.
- Decision gate: Decide whether to pursue, reprice, redesign, phase, partner, or walk away.
What matters is not rigid adherence to a template, but disciplined iteration. The workflow should become smarter over time as investors compare forecast assumptions to actual outcomes. In that sense, development analytics is not just a tool for one acquisition. It is a learning system for the entire investment platform.
What investors often get wrong
Even experienced investors can fall into familiar traps when evaluating development opportunities. One common mistake is relying too heavily on metro-wide growth while ignoring submarket oversupply. A city may have strong headline demand, but a specific corridor may be facing enough new deliveries to soften rents for several years. Another mistake is treating cheap land as a proxy for value. Land can be inexpensive precisely because constraints make it difficult, costly, or slow to develop.
A third error is assuming uniform rent growth across a market. Different product types can perform very differently even within the same neighborhood. New luxury product may face concession pressure while workforce housing remains undersupplied. Likewise, investors sometimes isolate climate risk from financial analysis, even though resilience issues can affect everything from entitlement to financing and long-term pricing.
Perhaps the most subtle mistake is underestimating delay. In development, time is often the most expensive hidden variable. Delays affect carrying costs, debt service, sales windows, lease-up competition, and the broader macro context into which a project ultimately delivers. Development analytics should therefore be as focused on timing risk as it is on revenue potential.
Where opportunity is strongest now
Current signals suggest that several opportunity themes remain compelling across North America, though always with local variation. Purpose-built rental continues to benefit from affordability constraints in the ownership market and persistent housing shortages in many cities. Infill and missing-middle formats also deserve close attention, especially where zoning reform or policy support improves the path to delivery. CMHC’s recent data on starts and affordability needs make clear that supply growth is not a niche issue. It is a central economic and social priority, which can translate into investment opportunity where policy, financing, and demand align.
That said, opportunity is increasingly selective. Markets with strong demand but limited oversupply risk may outperform even if national conditions remain mixed. Conversely, metros with large delivery pipelines may require more conservative assumptions even when long-term fundamentals look attractive. This is where development analytics offers an edge. It helps investors distinguish between broad thematic opportunity and site-specific viability.
A practical framework for evaluating one site
Imagine an investor reviewing an urban infill parcel near transit in a growing secondary Canadian market. The city’s population is rising, rents have grown steadily, and municipal policy supports higher-density housing. At first glance, the deal looks promising. But a proper analytics review would go further. It would test household growth by renter age group, examine the nearby rental pipeline, map walking access to jobs and transit, assess whether utility upgrades are required, review the probability of receiving density relief, and compare achievable rents against replacement cost.
The investor would then model multiple outcomes. What happens if lease-up takes six months longer than planned? What if financing costs stay elevated? What if construction bids come in 8% above expectation? What if nearby deliveries trigger more concessions in the first year? By answering these questions before acquisition, the investor gains leverage in negotiation and clarity in decision making. The result may be a confident yes, a redesigned concept, a lower land price target, or a disciplined no. All four are valuable outcomes.
Development analytics as a strategic advantage
In modern real estate investing, information alone is no longer enough. The advantage comes from organizing that information into decisions faster and more accurately than the market average. Development analytics provides exactly that. It helps investors test whether demand is real, whether supply risk is manageable, whether entitlements are achievable, whether costs are survivable, and whether the final return justifies the complexity.
This is especially important in a period defined by evolving market conditions. Canada’s rising housing starts and significant affordability gap point to long-term need. Freddie Mac’s outlook reminds investors that supply pressure can still shape near-term performance. Construction spending data, public financing programs, zoning reform, and climate risk all show that development outcomes are being driven by a wider set of variables than in the past. The old habit of relying on land price and a broad market narrative is no longer sufficient.
For investors willing to build a rigorous analytics stack, the payoff is not just better forecasting. It is better capital allocation. It is knowing when to move quickly, when to renegotiate, when to redesign, and when to walk away. In development, avoiding a weak deal is often as valuable as finding a strong one.
Harnessing development analytics is ultimately about making real estate investment decisions with sharper intelligence and fewer blind spots. The investors who succeed in the next cycle are unlikely to be those with the loudest market opinions. They will be the ones who can translate data into feasibility, feasibility into strategy, and strategy into resilient returns.


No Comment! Be the first one.