


Economic growth data refers to the metrics that measure how a city’s economy is expanding, including GDP, employment growth, business investment, and labor-force participation. Cities use this data to decide where to expand infrastructure, how transit lines are prioritized, which neighborhoods receive new services, and whether housing supply is keeping pace with local demand. When the data is accurate and interpreted at the right scale, it gives planners and policymakers a clearer view of how a city actually functions rather than how it appears on a map. That distinction matters because urban development is not just about adding buildings. It is about improving how people live, move, work, and access opportunity.
Table Of Content
- Why economic growth data matters in urban development
- The importance of measuring growth at the right geographic scale
- Why functional urban areas produce better planning insight
- What economic growth data should include beyond GDP
- Key indicators that make growth data more actionable
- How economic growth data guides specific urban planning decisions
- Why affordability and quality of life must be part of the same conversation
- Inclusive growth as a practical planning standard
- Common misconceptions that weaken urban analysis
- How cities are using data-driven urban intelligence now
- A practical framework for analyzing economic growth data in urban development
- Questions every city should ask when reviewing growth data
- What this means for the future of sustainable cities
- Conclusion
Across Canada and North America, cities operate as the main engines of economic output, innovation, and employment. UN-Habitat states that cities generate over 70% of global GDP, which makes urban areas central to both prosperity and pressure. As jobs concentrate in metropolitan regions, demand also rises for housing, transportation, utilities, schools, green space, and social infrastructure. Economic growth data helps cities identify these pressures early, assess whether growth is inclusive, and direct investments where they can support sustainable outcomes rather than reactive fixes.
The challenge is that economic growth can be misleading when it is read too narrowly. A city may report strong output gains while residents face longer commutes, rising rents, worsening air quality, and declining affordability. GDP growth alone is not a full picture of urban success. For development to be truly effective, cities must connect growth data with housing affordability, mobility, labor-market participation, service access, and broader quality of life indicators. This is where urban intelligence becomes valuable. It turns economic numbers into decision-ready insight.
This article explores how economic growth data supports sustainable urban planning and better living standards. It explains which data matters most, why geography matters, how common misconceptions can distort planning, and how cities can build a more intelligent framework for future development. The goal is not to treat data as abstract economics. The goal is to show how the right data can guide practical decisions that affect residents every day.

Why economic growth data matters in urban development
Urban development works best when it reflects real patterns of economic activity. If a city sees employment growth in a suburban logistics corridor, for example, that may create pressure for better road access, more bus service, or additional housing nearby. If a downtown knowledge sector is expanding, the implications may include office demand, transit ridership growth, and rising residential prices in surrounding neighborhoods. Economic growth data helps planners move from assumptions to evidence. It reveals where jobs are being created, where investment is clustering, and whether local productivity gains are likely to increase future service demand.
This matters because cities do not grow evenly. Some districts attract high-value sectors and experience rapid appreciation, while others lag behind and lose access to opportunity. Without good data, cities can underinvest in emerging areas or overlook signs of spatial inequality. With better economic intelligence, leaders can detect whether growth is concentrated in a few enclaves or spreading more broadly across the urban region. That informs zoning, utility planning, transport capacity, and social investment strategies.
Economic growth data also supports better timing. Urban projects often take years to approve, finance, and build. Transit systems, housing pipelines, and water infrastructure cannot respond overnight. Planners need forward-looking signals from employment patterns, business formation, sector output, and labor-market participation to anticipate future demand before service gaps become severe. In this sense, growth data is not just descriptive. It is predictive when used carefully.
There is also a fiscal dimension. Municipal governments rely on taxes, fees, and intergovernmental transfers, and their ability to maintain infrastructure often depends on the strength of the local economy. A city with weak economic growth may struggle to fund transit upgrades or expand public amenities. A city with rapid growth may collect more revenue but face sharper pressure to keep up with housing, roads, schools, and climate resilience spending. Good economic data helps local governments understand not just how much growth is occurring, but how that growth affects municipal fiscal capacity.
The importance of measuring growth at the right geographic scale
One of the biggest mistakes in urban analysis is relying too heavily on national numbers. National GDP may show strong growth while particular metropolitan areas are slowing, overheating, or structurally changing. The same is true within provinces and states. Looking only at broad averages can hide the dynamics that actually shape urban life. For city planning, the useful question is rarely, “How is the country doing?” It is more often, “What is happening in this labor market, along this transport corridor, or within this metropolitan region?”
In Canada, this local perspective is increasingly possible because Statistics Canada publishes GDP at basic prices by census metropolitan area. That makes city-level comparison far more practical. It allows analysts to examine where output is rising, which metros are gaining momentum, and how sector composition differs between places. This matters because urban Canada is highly concentrated. According to the 2021 Census, 61.2% of Canadians lived in large urban population centres of 100,000 or more. Since the majority of demand for housing, transit, health services, and infrastructure is concentrated in and around these regions, metropolitan data is essential for planning.
The same principle applies across North America. In the United States, the Bureau of Economic Analysis and OECD regional datasets help analysts compare metro economies, labor-market trends, and productivity patterns. These data sources are especially useful for understanding how different city regions perform over time and how development trajectories diverge even within the same national economy. A fast-growing metro with weak transit and expensive housing needs a very different policy response from a slower-growing metro with underused land and stagnant wages.
Geography also matters because city boundaries can be misleading. Residents often live in one municipality, work in another, and use services across a much wider region. Freight, labor, and transit systems rarely stop at administrative borders. That is why planners increasingly focus on functional urban areas and metropolitan regions rather than relying only on municipal boundaries. These larger geographies better reflect commuting patterns, housing catchments, and economic linkages. They produce a more realistic picture of how cities operate in practice.

Why functional urban areas produce better planning insight
A functional urban area captures the real footprint of a city’s economy. It includes the core urban centre and the surrounding areas that are connected to it through commuting, service access, and economic exchange. This approach is often more useful than city limits because it reflects where residents actually work and how infrastructure is truly used. A suburban municipality may appear independent on paper while in reality functioning as part of the same labor market and housing system as the central city.
When planners use functional geographies, they can make better decisions about transport, housing targets, and infrastructure coordination. It becomes easier to see whether new housing is being built in places with access to jobs, whether transit investment aligns with commuting demand, and whether peripheral growth is increasing congestion or supporting balanced regional development. This is especially important in large metropolitan areas where governance is fragmented across many municipalities but the economic system is shared.
OECD research often highlights that metropolitan areas tend to show higher GDP per capita than other areas because of agglomeration economies and productivity advantages. Those gains come from proximity, specialization, labor pooling, and better knowledge exchange. But the benefits only translate into better urban outcomes when the surrounding systems can absorb them. If transport breaks down, if housing becomes inaccessible, or if infrastructure is unevenly distributed, the productivity premium can turn into a quality-of-life penalty.
What economic growth data should include beyond GDP
GDP is an important signal, but on its own it is incomplete. It measures economic output, not distribution, affordability, accessibility, or environmental quality. A city can generate impressive output while large sections of its population remain excluded from the benefits. That is why modern urban planning increasingly combines GDP with a wider basket of indicators. The goal is to understand whether growth is durable, inclusive, and aligned with residents’ daily experience.
The most useful approach is to connect output data with labor, housing, mobility, and well-being metrics. Employment growth shows whether output is translating into jobs. Wage and income data reveal whether households are actually benefiting from local expansion. Housing price and rent trends show whether growth is making a city less accessible. Commute patterns indicate whether people can realistically reach opportunity. Air quality, emissions data, and green space access reveal whether development is sustainable over time.
The OECD and UN-Habitat consistently stress that cities should not treat economic growth as a stand-alone success metric. Cities may be strong engines of output while still having deep gaps in affordable housing, services, amenities, and opportunity. This is visible in many large North American metros, where rising productivity and strong demand have often been accompanied by housing shortages and cost burdens. In those cases, growth data becomes more useful when it is read alongside measures of stress.
Canada offers a helpful example of broader measurement through the Quality of Life Framework and the Canadian Indicator Framework for the Sustainable Development Goals. These frameworks encourage a more complete view of progress by linking economic conditions to health, environment, inclusion, safety, housing, and belonging. For urban planning, this broader lens is valuable because it keeps development grounded in lived outcomes rather than output alone.
Key indicators that make growth data more actionable
When cities build dashboards for urban development, some indicators are especially useful because they connect directly to planning choices. Employment by sector helps reveal whether a city’s growth is being led by manufacturing, logistics, technology, education, health care, tourism, or public services. Housing affordability ratios show whether residents can stay in the city as growth accelerates. Transit access and commuting times reveal whether jobs and homes are becoming more connected or more separated. Labor-force participation rates show whether residents are able to engage with the local economy or are being left out.
Other indicators add depth to the picture. Infrastructure access can show whether growth is putting pressure on water, energy, schools, and digital connectivity. Quality-of-life measures can reveal whether new development is improving neighborhoods or simply intensifying pressure. Air quality, flood risk, and emissions data become increasingly important as cities try to align economic development with climate goals. Taken together, these metrics help leaders ask a better question than “Is the city growing?” They ask, “Is the city growing in a way that people can actually sustain and benefit from?”
A practical urban dashboard often includes a mix of economic, social, spatial, and environmental indicators. The strongest versions are updated regularly, mapped geographically, and compared over time. They allow planners to identify where policy is working and where intervention is needed. They also improve transparency. Residents can see how development decisions connect to measurable conditions in their communities.
Strong urban planning does not ignore growth. It places growth in context, tests whether it is inclusive, and asks whether residents can feel its benefits in housing, mobility, services, and daily life.
How economic growth data guides specific urban planning decisions
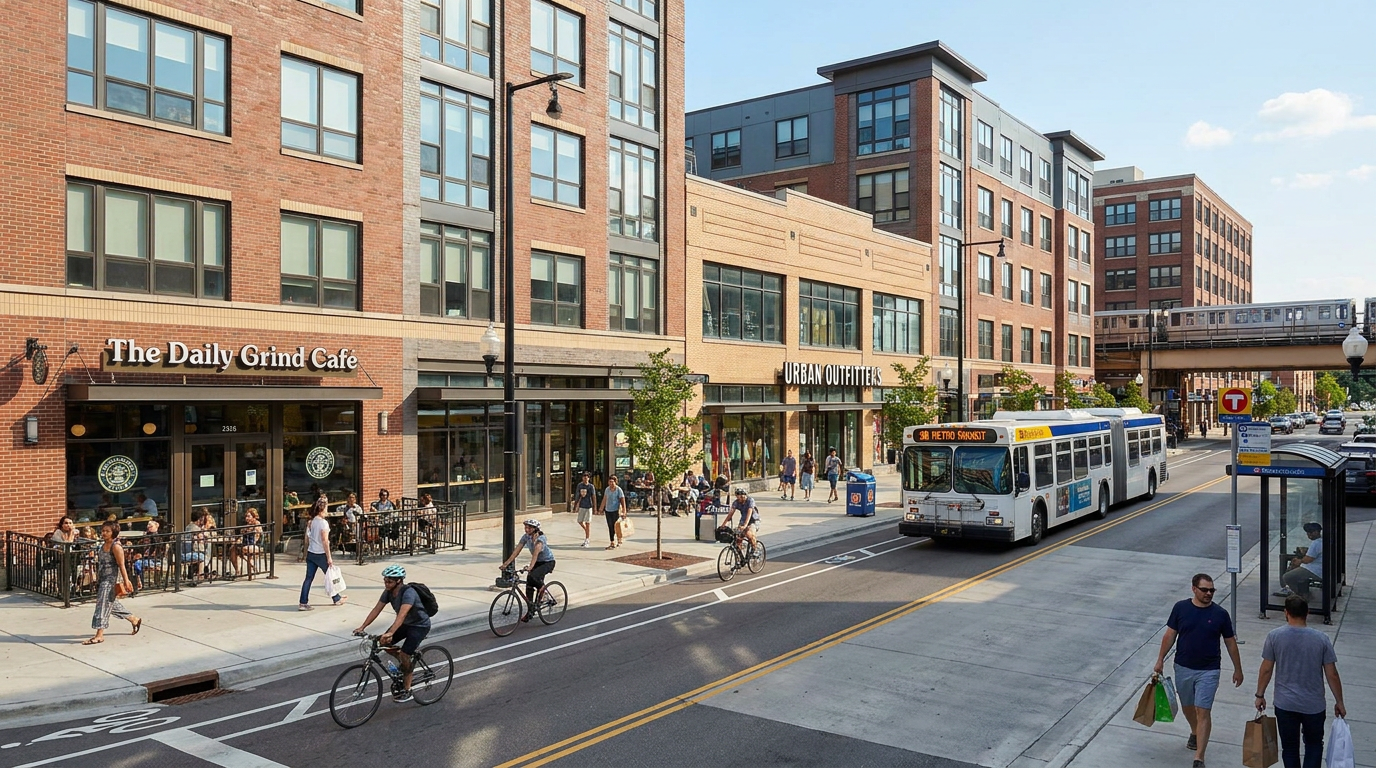
Economic growth data becomes truly valuable when it shapes concrete decisions. In transportation planning, for example, job concentration data can help determine where transit capacity should increase. If employment growth is clustering around emerging suburban business parks, planners may need orbital bus routes, better park-and-ride access, or new commuter rail connections. If downtown employment is rising rapidly, the priority may be higher-frequency rapid transit, last-mile connections, and pedestrian improvements.
In housing policy, growth data helps cities estimate demand more accurately. Rising output and employment often increase migration into a region, which intensifies pressure on both rental and ownership markets. If planners ignore this connection, supply can lag for years. The result is a familiar pattern of rent inflation, displacement, labor shortages, and longer commutes from more affordable but distant areas. Linking housing targets to economic and demographic signals can help cities respond earlier and more proportionately.
Land use planning also depends on understanding local growth dynamics. A city with expanding innovation sectors may need to preserve employment land near major transit nodes while allowing more mixed-use housing nearby. A region with growth in logistics and light industrial activity may need freight-sensitive zoning, road capacity management, and buffers to protect nearby communities. Economic data gives land use policy a clearer rationale. It helps cities align scarce land with the activities that support long-term resilience.
Public services are another important area. School capacity, health access, recreation, and utility demand all change as local economies evolve. A major employment expansion in one corridor can lead to residential pressure in adjacent neighborhoods, which then affects child care, parks, local roads, and emergency services. Data allows cities to see these links before infrastructure becomes overloaded. It supports sequencing, which is often the difference between orderly urban growth and reactive catch-up planning.
Why affordability and quality of life must be part of the same conversation
One of the most persistent misconceptions in urban development is that higher GDP automatically leads to better living conditions. In reality, many economically successful cities struggle with affordability crises, congestion, service gaps, and inequality. This is not a contradiction. It is often the result of growth that outpaces housing supply, infrastructure delivery, and governance capacity. Economic success can increase pressure as quickly as it increases opportunity.
OECD urban reporting has repeatedly noted that large urban areas can generate strong economic output while still facing persistent gaps in housing and services. More recent reporting has also highlighted rapid housing cost growth in large functional urban areas. This matters because housing affordability affects far more than household budgets. It influences labor mobility, commute distances, talent attraction, neighborhood stability, and even emissions. When workers cannot afford to live near jobs, cities become less efficient and less inclusive at the same time.
Quality of life is therefore not a soft add-on to economic planning. It is part of urban economic performance. A city with severe housing stress, poor mobility, and limited amenities may lose productivity over time as firms struggle to recruit and retain workers. Residents may face longer travel times, lower disposable income, and reduced access to opportunity. Conversely, cities that manage growth well can improve both competitiveness and everyday living standards.
That is why quality-of-life frameworks are becoming more important in public decision-making. They make it harder to celebrate growth while ignoring whether residents feel squeezed. They also help prioritize projects that may not maximize short-term output but improve long-term urban functioning, such as public transit reliability, climate adaptation, neighborhood parks, or missing-middle housing in accessible locations.
Inclusive growth as a practical planning standard
Inclusive growth means that the benefits of economic expansion are more widely shared across neighborhoods and population groups. In planning terms, this often translates into better access to jobs, more attainable housing options, stronger public transport, and a fairer distribution of services and amenities. It also means watching for spatial inequality. If a city’s wealth and investment are concentrating in a few districts while other areas lose access to opportunity, growth may be impressive on paper but unstable in practice.
UN-Habitat’s City Prosperity Initiative reflects this broader understanding. It uses more than 100 indicators across productivity, infrastructure, quality of life, equity, environmental sustainability, and governance. That structure is useful because it mirrors the way cities actually function. Prosperity is not just a count of output. It is a combination of systems that shape whether residents can participate in and benefit from urban growth.
For local governments, inclusive growth can be translated into measurable questions. Are low- and middle-income households being priced out of transit-accessible neighborhoods? Are new jobs reachable without a car? Are public investments following population and employment change? Are climate risks disproportionately concentrated in under-resourced communities? Economic growth data becomes more powerful when it helps answer questions like these.
Common misconceptions that weaken urban analysis
Several misconceptions regularly distort the way people use economic growth data in urban planning. The first is the idea that GDP growth alone equals urban success. This is attractive because GDP is simple, widely reported, and easy to compare. But cities can produce more while becoming less affordable, more unequal, and harder to navigate. Output is necessary information, but it is not sufficient.
The second misconception is that city boundaries are the best unit of analysis. For many planning questions, they are not. Housing markets, labor markets, and infrastructure systems spill across jurisdictions all the time. Focusing too narrowly on municipal borders can produce fragmented responses to what are really metropolitan issues. Functional urban areas and commuting sheds usually offer a more accurate frame.
The third misconception is that economic growth data is only useful to economists. In reality, it is relevant to zoning, transit investment, housing supply, utility planning, public service placement, and climate adaptation. A planner deciding where to permit more density, a transit agency redesigning bus service, or a housing team setting targets all rely on signals that come directly or indirectly from economic performance data.
A fourth misconception is that higher density always guarantees better outcomes. Density can improve transit viability, land efficiency, and productivity, but only if supported by infrastructure, housing diversity, and public realm quality. Without those supports, density can intensify pressure rather than relieve it. Finally, short-term construction booms should not be confused with long-term productivity growth. New development can inflate activity in the near term without creating a more resilient economic base if jobs, services, and affordability remain fragile.
How cities are using data-driven urban intelligence now
A clear trend in urban policy is the rise of integrated dashboards that combine economic data with spatial and social indicators. Rather than treating GDP, housing, and mobility as separate files in separate departments, cities are increasingly bringing them together into a unified planning view. This makes development decisions more coherent. It allows officials to see, for instance, whether employment growth in one corridor is being matched by housing permits, school capacity, transit service, and climate resilience investments.
This trend is especially relevant in North America, where housing costs in major metropolitan areas have risen sharply and climate-related planning needs are becoming more urgent. Local governments are under pressure to make faster decisions, but speed without evidence can create expensive mistakes. A stronger intelligence layer helps cities test assumptions, prioritize projects, and communicate tradeoffs more clearly to the public.
Urban analytics is also becoming more spatial. It is not enough to know that a metropolitan economy grew by a certain percentage. Planners want to know where that growth occurred, which neighborhoods gained jobs, how commuting patterns changed, and where affordability worsened most. Mapping these changes reveals patterns that averages miss. It can show whether growth is transit-oriented or car-dependent, compact or sprawling, equitable or exclusionary.
Climate-linked planning is another major development. Cities are increasingly using local economic data to prioritize resilient infrastructure and green investment. If a district is both economically strategic and highly exposed to flood risk, that can justify accelerated resilience spending. If green industries are clustering in a particular area, that may support transit improvements, workforce programs, or industrial land protection. Economic growth data becomes part of climate strategy when cities treat resilience as an investment in future productivity and livability.
A practical framework for analyzing economic growth data in urban development
For planners, developers, and local leaders, the most useful approach is to build a repeatable framework rather than looking at isolated numbers. The framework should begin with the right geography. Use metropolitan areas or functional urban areas wherever possible so that labor-market and infrastructure relationships are visible. Then identify a core set of indicators that can be tracked consistently over time.
A strong baseline usually includes GDP or output, employment growth, sector composition, labor-force participation, housing prices and rents, permits or completions, transit access, commuting times, municipal fiscal signals, and environmental risk indicators. These should be read together, not separately. If output is rising but commute times and housing costs are worsening quickly, the planning response should differ from a case where output and affordability are improving in parallel.
Next, add spatial detail. Compare neighborhoods, corridors, and subregions to reveal uneven growth patterns. Look for areas where jobs are growing faster than housing, where population is rising faster than services, or where infrastructure risk overlaps with social vulnerability. The value of the framework comes from these intersections. That is where policy becomes more targeted and more effective.
Finally, connect analysis to decisions. Data should influence zoning updates, infrastructure sequencing, affordable housing strategy, transit planning, and climate adaptation priorities. If the analysis remains descriptive, it has limited public value. If it shapes decisions and is updated as conditions change, it becomes an intelligence system rather than a reporting exercise.
Questions every city should ask when reviewing growth data
-
Where is economic output increasing, and which sectors are driving it? This helps clarify whether growth is broad-based, cyclical, or concentrated in a few industries.
-
Are housing supply and affordability keeping pace with employment growth? If not, labor-market gains may be undermined by displacement and long-distance commuting.
-
Do transportation networks connect residents to expanding job areas efficiently? Growth that is hard to reach is less inclusive and often more carbon-intensive.
-
Which neighborhoods are capturing investment, and which are being left behind? This helps identify spatial inequality before it becomes entrenched.
-
How does economic growth align with climate resilience and environmental sustainability goals? Development that ignores climate risk may create future liabilities rather than long-term prosperity.
What this means for the future of sustainable cities
The future of urban development will depend increasingly on how well cities interpret complex data rather than how much data they possess. Most large urban regions already have access to economic, housing, demographic, mobility, and environmental information. The real challenge is integration. Cities need systems that connect these signals clearly enough to support better decisions at the pace modern growth demands.
Accurate economic growth data is central to that effort because it helps explain the pressures behind urban change. It shows where jobs are emerging, how productivity is shifting, and which regions are becoming more economically significant. But its true value appears only when it is linked to the things residents feel most directly, such as rent, commute time, service access, and neighborhood quality. Sustainable planning depends on making those connections explicit.
For Canada and North America, the path forward is increasingly clear. Use credible metro-level data from sources such as Statistics Canada, the OECD, UN-Habitat, Canada’s quality-of-life and SDG frameworks, and the U.S. Bureau of Economic Analysis where comparisons are helpful. Analyze growth at functional urban scales. Pair output with affordability, inclusion, and resilience indicators. Build dashboards that can support both long-term strategy and near-term action.
Urban development is often described as a contest between growth and livability, but that framing is too narrow. The better question is how growth can be understood well enough to support livability. Economic growth data does not answer every planning challenge, but it gives cities a far stronger starting point. Used wisely, it helps leaders invest earlier, plan more fairly, and create urban environments where prosperity is visible not only in economic reports but in the daily quality of life of the people who live there.
Conclusion
Understanding economic growth data is essential for anyone shaping the future of cities. It informs transit, housing, land use, infrastructure, public services, and climate resilience. More importantly, it helps cities move beyond simplistic narratives of success and ask whether growth is truly improving life for residents. In a period defined by affordability pressure, urban concentration, and climate risk, that question is no longer optional.
The most effective urban planning now relies on a broader intelligence model. It combines GDP and productivity with housing affordability, access to jobs, quality of life, and sustainability indicators. It looks at metropolitan and functional urban areas rather than narrow administrative lines. It treats data not as a static report but as an active tool for making better choices. When cities work this way, economic growth data becomes more than a number. It becomes a guide for building places that are more resilient, equitable, and genuinely livable.


No Comment! Be the first one.