



In most organizations, leaders do not suffer from a lack of data. They suffer from a lack of clarity. Revenue numbers live in one system, operational metrics sit in another, customer service reports arrive by email, and finance closes the month on a different timeline than sales. By the time an executive team has stitched together the story, the business has often moved on. Executive intelligence systems exist to solve this problem by turning scattered business information into a focused decision environment that helps leaders see what matters, what is changing, and what requires action.
Table Of Content
- What Is an Executive Intelligence System?
- Why Businesses Use Executive Intelligence Systems in Daily Operations
- How Executive Intelligence Systems Actually Work
- The Core Components of an Effective Executive Intelligence System
- Curated KPIs
- Trends and Context
- Alerts and Exceptions
- Drill-Down Paths
- Governance and Security
- Executive Dashboard vs Report vs Data Warehouse
- What a Good Executive Intelligence Dashboard Looks Like
- How AI Is Changing Executive Intelligence Systems
- Common Business Use Cases Across Industries
- How to Implement an Executive Intelligence System as a Beginner
- Step 1: Define the Executive Questions
- Step 2: Choose the Core KPIs
- Step 3: Build the Data Foundation
- Step 4: Design for One-Screen Clarity
- Step 5: Add Drill-Down and Alerts
- Step 6: Establish Governance and Access Controls
- Step 7: Train for Interpretation, Not Just Navigation
- Common Mistakes to Avoid
- How to Measure Success
- The Future of Executive Intelligence Systems
- Final Thoughts
For beginners, the term can sound more complicated than it really is. An executive intelligence system is not a mysterious AI brain running the company behind the scenes. In practical terms, it is usually a combination of executive dashboards, business intelligence tools, governed metrics, alerts, and drill-down reports that allow senior decision-makers to monitor performance without digging through raw data. It is the intelligence layer that sits between enterprise data and executive action.
That distinction matters. A data warehouse stores information. A report explains a slice of it. An executive intelligence system helps leaders run the business. It presents a curated, trusted view of the organization using high-level indicators such as revenue, margin, pipeline health, service levels, fulfillment rates, workforce capacity, and strategic goals. Instead of asking executives to search for insight, it brings insight to the surface in a format built for speed.
This is why executive intelligence systems are becoming so important across North America in sectors such as finance, healthcare, retail, manufacturing, logistics, and the public sector. Mid-market and enterprise organizations increasingly need a single version of key metrics, less reporting friction, and better visibility into exceptions before they become larger problems. The shift is not mainly about making dashboards more attractive. It is about making performance easier to understand and easier to improve.
In this guide, we will break down what executive intelligence systems are, how they work, what components they include, and how to implement them in a way that actually helps everyday business operations. The goal is not to impress with jargon. The goal is to make complex data interpretation accessible for decision-makers who need answers quickly and reliably.

What Is an Executive Intelligence System?
An executive intelligence system is a decision support environment designed for senior leaders. It pulls together carefully selected metrics, trends, alerts, and visual summaries so executives can assess business health at a glance. In many cases, this system is delivered through a dashboard inside platforms such as Power BI, Tableau, or IBM Cognos Analytics, supported by reports, semantic models, and secure access rules behind the scenes. Rather than replacing data warehouses or detailed reports, it sits on top of them, translating raw enterprise data into a curated view built for monitoring and action. The goal is not to display every available metric, but to surface the handful of indicators, such as revenue, margin, service levels, and pipeline health, that tell leaders whether the business is on track, what has changed, and where intervention is needed.
One of the most useful ways to understand the concept is to compare it with other analytics assets. A transactional report shows detailed activity such as orders, invoices, claims, shipments, or staffing records. A dashboard shows a concise overview of the most important indicators. Microsoft describes dashboards as single-page overviews designed to display the most important information at a glance, while Tableau frames executive dashboards as tools for visualizing crucial metrics for the executive team. In other words, the executive intelligence layer is meant for monitoring and direction, not for line-by-line operational administration.
That does not mean it is superficial. A good executive intelligence system allows a leader to start with a high-level scorecard and then drill into supporting detail when a metric changes unexpectedly. If gross margin falls, the executive should be able to see whether the issue stems from pricing, product mix, regional performance, supply costs, or service delivery inefficiencies. The overview remains simple, but the path to explanation is built in.
This combination of simplicity and depth is why executive intelligence systems matter. They reduce ambiguity without hiding complexity. They give leaders a controlled way to move from signal to diagnosis without requiring them to manually reconcile spreadsheets, request ad hoc analysis, or wait for a slide deck to be prepared.
Why Businesses Use Executive Intelligence Systems in Daily Operations
It is tempting to think of executive dashboards as tools used only in quarterly board meetings or annual planning sessions, but their real value shows up in everyday operations. Businesses use executive intelligence systems to keep leaders aligned on the same facts, monitor performance against targets, and respond faster when conditions shift. In practical terms, that means fewer debates about which number is correct and more attention on what action should be taken.
Consider a logistics company tracking on-time delivery, labor utilization, fuel cost trends, customer complaints, and route profitability. Each of those metrics may come from a different source system, yet they all contribute to executive decisions about staffing, pricing, service promises, and expansion. An executive intelligence system brings them into one trusted environment so the leadership team can assess the health of the operation in minutes rather than across several separate meetings.
The same logic applies in healthcare, where executives may need a consolidated view of wait times, occupancy, staffing levels, budget variance, and patient satisfaction. In retail, leaders may watch sales, conversion rates, returns, inventory turnover, markdown exposure, and labor scheduling. In manufacturing, they may focus on throughput, downtime, defects, margin, and supplier risk. Across these industries, the common goal is not just reporting. It is faster, better-informed management response.
Well-designed dashboards can also improve alignment. Tableau has noted that effective dashboards can align organizational efforts, uncover insights, and speed decision-making. That alignment is one of the least visible but most important benefits. When finance, operations, sales, and leadership all use the same KPI definitions and time windows, the organization wastes less energy resolving confusion and spends more energy improving outcomes.
How Executive Intelligence Systems Actually Work
At a high level, an executive intelligence system works by collecting data from operational and financial sources, transforming it into standardized metrics, and presenting those metrics through a dashboard interface designed for rapid interpretation. Behind the screen, there is usually more structure than most users realize. Data is extracted from source systems such as ERP platforms, CRM tools, HR software, service desks, and inventory systems. That data is cleaned, modeled, and linked to agreed definitions so the numbers presented to executives are consistent and trustworthy.
Once the data foundation is in place, the next layer is semantic meaning. This is where organizations define business terms such as revenue, net margin, active pipeline, service level attainment, customer churn, or average order value. Without this layer, executives may see the same label but interpret it differently across departments. Semantic models and governed KPI definitions create the single version of truth that an executive intelligence system depends on.
The final layer is the user experience. This includes the dashboard layout, KPI cards, trend lines, thresholds, alerts, commentary, drill-down links, and in some cases natural-language query tools. Power BI, for example, supports dashboard alerts and Q&A experiences so users can ask questions in plain language. Newer AI-assisted features can summarize reports and generate executive overviews, making interpretation faster for leaders who need concise answers rather than technical walkthroughs.
What makes this useful for beginners is that not every user needs to understand the full architecture. Executives care about whether the numbers are reliable, current enough for the decision at hand, and easy to interpret. The technical team cares about integrations, refresh schedules, modeling, and access controls. A strong implementation respects both perspectives. It hides the complexity from the user while preserving rigor in the background.
The Core Components of an Effective Executive Intelligence System
Curated KPIs
The heart of the system is a set of curated key performance indicators. These are not random metrics chosen because they happen to be available. They are selected because they represent the health of the business and connect directly to strategic and operational decisions. Executive audiences usually need summary-level KPIs rather than row-level transaction detail. That principle is widely recommended because leaders need orientation first and detail only when a signal warrants investigation.
Good KPI design requires discipline. A company might have hundreds of possible measures, but an executive dashboard should focus on the few that answer recurring leadership questions. What is changing? Where is risk building? Are we on target? What requires intervention today? If a metric cannot support one of those questions, it may belong in an analyst report rather than an executive intelligence environment.
Trends and Context
A single number rarely tells a complete story. If monthly revenue is 12 million dollars, is that strong or weak? The answer depends on target, prior period performance, seasonality, and forecast expectations. This is why trends and context are essential components. Executives need to see whether a metric is improving, deteriorating, or simply fluctuating within a normal range.
Context can come in several forms, including prior-year comparisons, rolling averages, target lines, benchmark ranges, and segment splits. The best executive intelligence systems avoid forcing leaders to infer too much from isolated figures. They make the direction and significance of change visible immediately.
Alerts and Exceptions
Not every metric needs constant attention. One of the most practical features in an executive intelligence system is exception-based monitoring. Alerts can notify leaders when inventory falls below threshold, customer satisfaction drops sharply, budget variance widens, or service levels miss targets. Instead of asking executives to continuously scan every metric for trouble, the system highlights material deviations automatically.
This is where dashboards evolve from static scorecards into active decision support tools. Rather than simply displaying performance, they help leaders focus attention where it is needed most. That saves time and reduces the risk that a meaningful warning sign will be buried in routine reporting noise.
Drill-Down Paths
Executives often begin with summary-level data, but they still need a route to explanation. A strong drill-down path lets users move from an enterprise-level KPI to region, product line, business unit, customer segment, or operational driver. If a service metric turns red, the executive should not need to request a separate report and wait until tomorrow. The supporting detail should be accessible through the same intelligence environment.
This does not mean executives need to become analysts. It means they need enough visibility to ask better follow-up questions and direct the right teams quickly. Drill-down should be intuitive, selective, and relevant to the business problem being explored.
Governance and Security
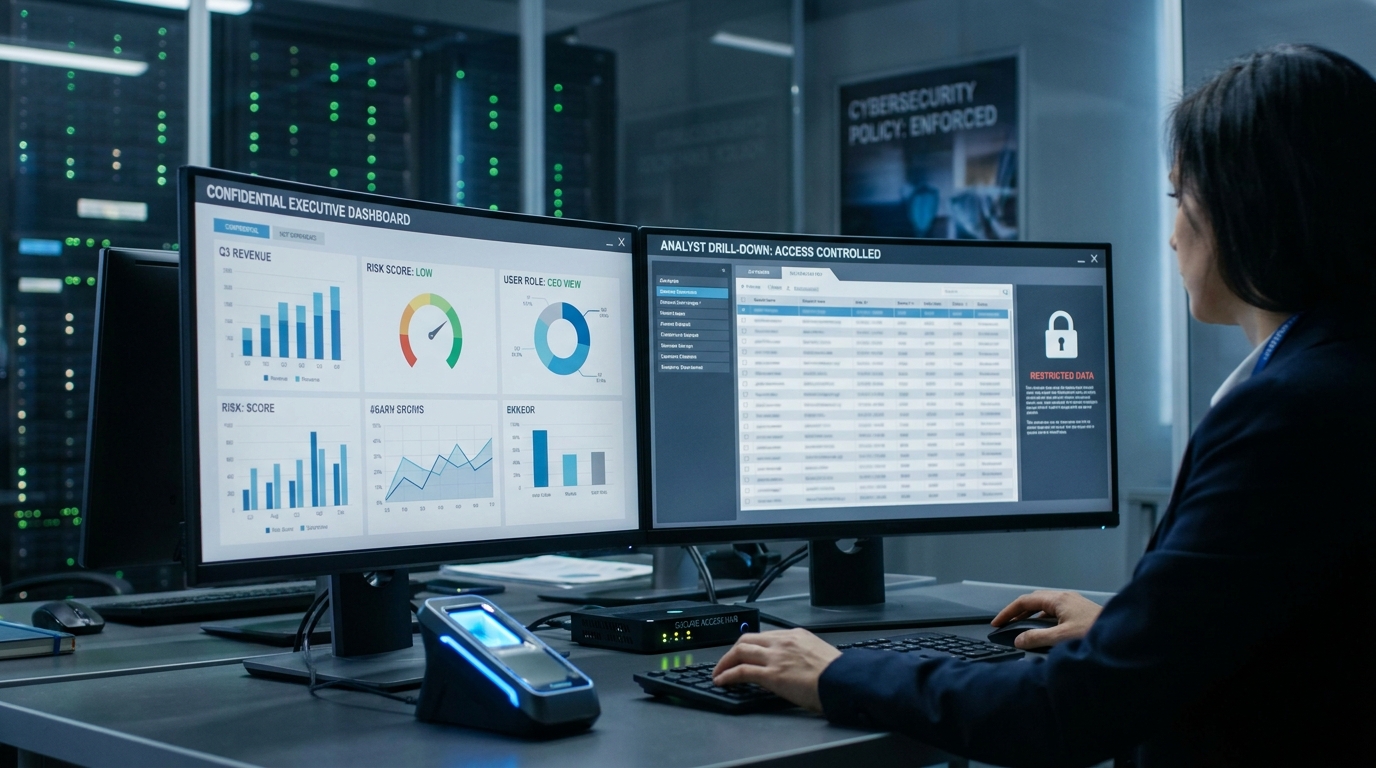
Because executive intelligence systems often expose sensitive financial, operational, workforce, and strategic information, governance is not optional. Secure access controls such as row-level security and object-level security help ensure that users only see what they are permitted to see. Controlled sharing patterns, governed BI environments, and approved metric definitions protect trust in the system.
This matters more than many beginners expect. A dashboard can be beautifully designed and still fail if leaders question the numbers, if access is too broad, or if business definitions change from one meeting to the next. The credibility of an executive intelligence system depends on governance just as much as visualization.

Executive Dashboard vs Report vs Data Warehouse
One of the most common misconceptions is that these terms all describe the same thing. They do not. A data warehouse is a storage and integration layer that consolidates information from multiple systems. A report provides detailed analysis, often with filtering, multiple pages, and transaction-level views. An executive dashboard is a concise overview meant to show the most important information at a glance. An executive intelligence system typically sits on top of the warehouse and includes dashboards plus guided drill-down into reports.
This distinction helps prevent a frequent implementation mistake: trying to show everything on the executive screen. More charts do not create more intelligence. In fact, clutter usually reduces clarity and slows decision-making. Microsoft guidance for dashboard design emphasizes designing for the audience, placing the most important information first, and using a clean one-screen layout where possible. That principle is especially important at the executive level, where cognitive load matters.
Another misconception is that dashboards must always be real-time to be valuable. In reality, the best refresh cadence depends on the decision cadence. A CEO does not necessarily need every metric updated every minute. Financial metrics may refresh daily, workforce metrics weekly, and operational alerts every hour. The objective is not maximum speed for its own sake. The objective is timely information matched to the business rhythm.
What a Good Executive Intelligence Dashboard Looks Like
A good executive dashboard feels calm even when the business is not. It presents a small number of essential KPIs, clear trend visuals, and obvious signals for areas that need attention. It does not ask users to search for the point. It tells the story of performance immediately, then allows deeper exploration if required. The visual experience should reduce effort, not increase it.
In most cases, the screen should prioritize enterprise outcomes first. Revenue, margin, pipeline, customer experience, operating efficiency, and strategic objective progress tend to belong near the top because they answer the broadest questions. Supporting metrics can then sit beneath or behind those headline numbers. The dashboard becomes a narrative of business health rather than a collage of unrelated widgets.
Design choices matter more than many teams realize. Executives benefit from plain language labels, restrained color use, consistent time periods, and a visual hierarchy that makes the most important information impossible to miss. If every chart is bright, animated, and visually dense, nothing truly stands out. The best dashboards are often the simplest because they respect how quickly busy leaders need to interpret information.
Practical rule: An executive should be able to answer three questions within the first minute of opening the dashboard: How are we doing, what changed, and where do we need to act?
That rule can guide nearly every design decision. If a visual does not help answer one of those questions, it may not belong on the main page. Supporting detail can still exist in linked reports, but the executive landing experience should remain focused and decisive.
How AI Is Changing Executive Intelligence Systems
Executive intelligence systems are becoming more conversational and more automated. AI-assisted summaries, natural-language querying, and machine-generated insights are increasingly embedded into business intelligence tools. Microsoft has introduced Copilot experiences that can summarize report content and generate executive overviews, which reflects a wider shift toward making analytics easier to interpret without requiring technical fluency.
For decision-makers, this can be genuinely useful. Instead of reading through several charts and narrative comments, an executive may ask a system why margin declined in the last quarter or what changed in regional sales performance. Natural-language analytics can highlight patterns, summarize trends, and direct the user toward relevant drill-down paths. This improves accessibility for leaders who think in business questions rather than in data model structures.
Still, AI does not eliminate the need for governance. An AI summary is only as good as the data and metric definitions behind it. If the organization has inconsistent KPI logic, incomplete source data, or uncontrolled access, the conversational layer can amplify confusion rather than reduce it. This is one reason analytics leaders continue to focus on business outcomes and trust, not just feature adoption. Gartner has reported that many chief data and analytics officers struggle to measure the impact of data, analytics, and AI on business results. That is a reminder that executive intelligence should connect metrics to action, not just generate impressive-looking explanations.
The most realistic near-term role for AI is augmentation. It can shorten the time between question and understanding. It can draft summaries, surface anomalies, and make dashboard environments easier to navigate. But it works best when layered onto a well-governed intelligence foundation rather than used as a substitute for one.
Common Business Use Cases Across Industries
Although the structure of executive intelligence systems is similar across sectors, the actual metrics differ based on operating model and risk exposure. In manufacturing, executives often monitor throughput, scrap rates, downtime, gross margin, safety incidents, and supplier performance. In logistics, they may watch on-time delivery, route efficiency, labor availability, customer claims, and warehouse capacity. In finance, the emphasis may fall on net interest margin, delinquency trends, cost-to-income ratio, portfolio growth, compliance events, and liquidity indicators.
Healthcare organizations often need a balance between financial and service delivery metrics. Executive dashboards may track occupancy, patient wait times, staffing shortages, budget performance, readmission rates, and patient satisfaction. Retail organizations may look at same-store sales, basket size, inventory turnover, markdown exposure, shrinkage, conversion rates, and labor productivity. Public sector environments often combine service levels, budget adherence, case resolution times, workforce metrics, and policy performance indicators.
Despite these differences, the reason for using executive intelligence systems remains remarkably consistent. Leaders need a trusted, shared view of performance that supports quicker intervention and better strategic coordination. The system becomes an operating layer for management rather than just a reporting convenience.
How to Implement an Executive Intelligence System as a Beginner
For teams just getting started, the smartest approach is to begin with decision needs rather than technology features. Many projects fail because they start with a dashboard template or a long list of available data fields. A stronger approach starts with executive questions. What decisions are made weekly, monthly, and quarterly? Which signals indicate that intervention is needed? Which metrics must be trusted by every department? Once those questions are clear, the system design becomes much easier.
Step 1: Define the Executive Questions
Interview senior leaders and look for recurring patterns. Which metrics are repeatedly requested in meetings? Which areas create confusion or delay? Which business outcomes matter most over the next 12 months? The goal is not to gather every wish list item. It is to identify the handful of decisions the dashboard must support consistently.
Step 2: Choose the Core KPIs
Select a manageable set of top-level KPIs tied directly to business performance. These should include clear definitions, owners, refresh frequencies, and thresholds. If possible, document why each KPI belongs on the executive page. This helps prevent dashboard sprawl later, when every department wants equal visual space regardless of strategic priority.
Step 3: Build the Data Foundation
Connect the relevant data sources and standardize the logic behind each metric. This is often the least glamorous part of the project, but it is where trust is won or lost. If sales, finance, and operations all calculate performance differently, the dashboard will quickly become a battleground. Align definitions early and document them clearly.
Step 4: Design for One-Screen Clarity
Use a clean layout that surfaces the most important information first. Avoid clutter and focus on readability. Summary-level KPIs, simple trend visuals, and a clear hierarchy usually outperform dense collections of charts. Design for the executive audience, not for analysts who enjoy digging through detail.
Step 5: Add Drill-Down and Alerts
Once the main page is stable, connect it to supporting reports or drill-down paths. Add alerts for critical thresholds so the system can actively flag change instead of waiting for someone to notice it. This turns the dashboard into a practical operating tool rather than a passive display.
Step 6: Establish Governance and Access Controls
Implement role-based access using mechanisms such as row-level security where appropriate. Clarify who owns each metric, who approves changes, and how data quality issues are handled. Executive intelligence systems often deal with sensitive content, so distribution and sharing need to be controlled thoughtfully.
Step 7: Train for Interpretation, Not Just Navigation
Many rollouts focus on where to click, but effective adoption depends on teaching leaders how to interpret signals consistently. Explain what each KPI means, what constitutes normal movement, which thresholds trigger action, and how drill-down should be used. The objective is not just technical adoption. It is decision-making discipline.
Common Mistakes to Avoid
The first mistake is trying to build a dashboard for everyone. Executive intelligence systems should be designed for executive use. That means summary-level metrics, concise visuals, and direct relevance to leadership decisions. If the page attempts to satisfy analysts, managers, and senior executives at once, it usually becomes too crowded for all three.
The second mistake is overloading the main view with too many charts. A better dashboard is not one that uses every available visual type. It is one that helps a leader see the current state of the business quickly and confidently. Restraint is not a limitation. It is a design advantage.
The third mistake is neglecting governance. Without trusted definitions, controlled sharing, and secure access, adoption erodes fast. Executives will not rely on a system they suspect is inconsistent or politically contested. Confidence in the metrics is as important as the interface itself.
The fourth mistake is assuming real-time data is always necessary. In some environments it is critical, especially where operational disruption needs immediate response. In many others, hourly or daily updates are more than sufficient. Refresh strategy should reflect the decision tempo and the cost of acting on stale information.
The fifth mistake is treating the launch as the finish line. Executive intelligence systems need refinement. Business priorities shift, KPI definitions evolve, and users discover where context is missing. The most successful teams review dashboard usage, collect feedback, and improve the system over time without losing governance discipline.
How to Measure Success
If the value of an executive intelligence system is not measured, it can drift into the category of attractive but underused technology. Success should be tied to business outcomes and management efficiency, not just to dashboard view counts. Useful indicators include reduced time spent preparing executive reports, faster issue escalation, improved alignment across departments, fewer disputes over KPI definitions, and measurable improvement in targeted operational metrics.
For example, if a company introduces dashboard alerts for fulfillment performance and then reduces late shipments through faster intervention, that is a clear business effect. If the executive team can cut meeting preparation time because performance updates are already trusted and available, that is also value. If strategic reviews shift from reconciling numbers to discussing action, the intelligence system is doing its job.
These measurement practices matter even more as AI enters the picture. Organizations increasingly need to show that analytics investments improve outcomes, not simply generate more content. A mature executive intelligence system should help leaders act earlier, align better, and focus attention where it creates the most operational impact.
The Future of Executive Intelligence Systems
The future of executive intelligence systems is less about flashy visuals and more about embedded decision support. Dashboards are increasingly appearing inside collaboration platforms and operational workflows rather than living as separate destinations. Leaders want insight where decisions already happen, whether that is in Teams, planning meetings, finance reviews, or cross-functional operating cadences.
We are also likely to see more hybrid experiences that combine scorecards, predictive indicators, AI-generated commentary, and recommendation layers. Instead of merely showing that a metric is off target, systems may increasingly suggest likely drivers, highlight peer comparisons, or prompt the next question to investigate. That can make executive interpretation faster, especially in complex organizations with many moving parts.
Still, the fundamentals will not change. Trusted data, simple design, strong governance, and metrics linked to business outcomes will remain the foundation. Technology can make interpretation easier, but it cannot rescue an organization from unclear definitions or weak performance management habits. The intelligence system is only as strong as the business discipline behind it.
Final Thoughts
Executive intelligence systems are best understood not as a luxury for large corporations, but as a practical management layer for modern organizations. They help leaders move from fragmented reporting to focused visibility. They reduce the time spent hunting for numbers and increase the time spent making decisions that improve performance.
For beginners, the key takeaway is simple. Start with the questions executives actually need answered. Build around a trusted set of KPIs. Design for clarity, not comprehensiveness. Add drill-down where explanation is needed. Protect the system with strong governance and role-based access. Then measure whether the system is changing how the business responds to risk, opportunity, and strategic priorities.
When done well, an executive intelligence system does not overwhelm leaders with data. It gives them a calm, credible view of the business and a faster path to action. In a market where speed, alignment, and trust increasingly shape performance, that is not just useful. It is a competitive advantage.



No Comment! Be the first one.