



Real estate investing often looks simple from the outside. You buy a property, collect rent, pay the bills, and hope the value rises over time. In practice, strong results come from something more disciplined. The best investors do not just own assets. They track asset performance carefully, compare actual results against expectations, and adjust quickly when conditions change.
Table Of Content
- What asset performance tracking actually means
- Why beginners should care about systems, not just spreadsheets
- The core metrics every beginner should track
- Occupancy rate
- Vacancy rate
- Rent collections
- Turnover rate
- Operating expenses
- Net operating income
- Debt service coverage ratio
- Cash on cash return
- Why benchmarking matters more than a single property report
- How automation improves asset performance tracking
- Examples of useful automation for beginners
- Building a simple monthly KPI dashboard
- Separating market signals from property signals
- The growing role of smart building and energy data
- Common mistakes beginners make when tracking performance
- A practical workflow for new investors
- How data driven tracking supports better investment decisions
- Final thoughts
For beginners, this can sound more technical than it really is. Asset performance tracking is simply the process of measuring how well a property is doing financially and operationally. It helps you answer practical questions. Is the building producing stable income? Are costs rising too quickly? Is tenant turnover becoming a hidden problem? Is performance weaker because of the property itself, or because the broader market is softening?
Those questions matter more today because real estate is becoming more data driven. Manual reporting still exists, but modern investors increasingly rely on automation, smart dashboards, and integrated property systems to monitor performance in real time. That shift is not just about convenience. It reduces lag, improves consistency, and makes it easier to detect issues before they become expensive.
This guide explains the foundations of asset performance tracking in clear terms. You will learn which metrics matter most, how to interpret them, why benchmarking is essential, and how automation can give even small investors a sharper operating edge. If you are new to real estate analytics, think of this as the intelligence layer behind better property decisions.
In Canada especially, the case for disciplined tracking is easy to see. CMHC data has shown that vacancy and turnover increased across many markets in recent reporting periods, while local conditions varied meaningfully by city and by rent quartile. At the same time, broader commercial segments have behaved differently. PwC’s Canada market outlook reported national office vacancy at 18.7% in the second quarter of 2025. That kind of divergence is a reminder that no single headline can explain asset performance. You need systems that separate market noise from property level reality.
What asset performance tracking actually means
Asset performance tracking is the disciplined measurement of how each property contributes to income, value creation, risk control, and long term portfolio goals. In simple terms, it is how owners move from intuition to evidence. Instead of saying a building feels healthy, you can show that occupancy is stable, collections are strong, expenses are within range, and debt coverage remains comfortable.
It is important to understand that asset performance is not the same as rent growth. A building can post higher asking rents and still underperform if concessions rise, delinquencies increase, maintenance costs accelerate, or a major capital issue starts draining cash flow. Beginners often focus too heavily on top line rent because it is visible and easy to celebrate. The stronger habit is to track the full operating picture.
Performance also needs to be understood at multiple levels. There is the market level, where interest rates, supply, job growth, and migration shape demand. There is the submarket level, where neighborhood quality, rent bands, and product type create more specific conditions. Then there is the individual asset level, where management quality, unit condition, tenant mix, and operational discipline influence results. A well designed tracking system helps you see all three at once.
Good asset management is rarely about reacting to one bad month. It is about seeing patterns early enough to act before they become structural problems.
That is why smart tracking matters. It gives you visibility into trends, not just snapshots. A rent dip might mean very little on its own. A three month slide in collections combined with rising turnover and growing repair volume tells a different story. Modern real estate investing is increasingly won through that kind of connected insight.
Why beginners should care about systems, not just spreadsheets
Many new investors start with a spreadsheet, and that is understandable. Spreadsheets are flexible, familiar, and low cost. The problem is not that spreadsheets are useless. The problem is that they are often too manual for accurate, repeatable asset tracking. Numbers get updated late, formulas break, categories drift, and different properties end up being measured in slightly different ways.
That inconsistency matters more than most beginners realize. If one property records vacancy based on physical occupancy and another records it based on unpaid units, your comparison is already flawed. CMHC’s methodology is useful here because it defines a vacant unit as physically unoccupied and available for immediate rental, while turnover refers to a unit occupied by a new tenant within the past 12 months. Those definitions may seem basic, but they protect investors from apples to oranges reporting.
Automation solves much of this friction. When accounting software, leasing records, maintenance logs, and rent rolls feed into the same reporting environment, owners spend less time gathering data and more time interpreting it. Automated systems also reduce reporting lag. Instead of waiting until month end to discover weak collections or expense spikes, you can see warning signals earlier.
For modern investors, the goal is not to eliminate judgment. It is to support judgment with cleaner and faster information. Automation creates the foundation for that. It turns property management data into a continuous operating signal rather than a backward looking administrative task.

The core metrics every beginner should track
If you are just starting out, you do not need a giant analytics stack. You need a small set of metrics that capture revenue stability, cost control, financing resilience, and long term asset quality. The most practical starting point includes occupancy, vacancy, rent collections, turnover, operating expenses, net operating income, debt service coverage ratio, and cash on cash return. These metrics work because together they describe whether the asset is earning, leaking, or drifting.
Occupancy rate
Occupancy rate measures how much of your rentable space is occupied. In multifamily, it tells you what percentage of units are currently leased. A high occupancy rate usually suggests healthy demand, but it should not be viewed in isolation. A building can be full and still underperform if rents are below market or collections are weak.
For beginners, occupancy is useful because it is intuitive and easy to monitor. If occupancy falls unexpectedly, it may point to pricing issues, marketing weakness, unit condition problems, or broader market softness. If occupancy remains high but revenue is underwhelming, the issue may be rent strategy rather than demand.
Vacancy rate
Vacancy rate measures the share of units that are physically unoccupied and available for rent. This is one of the clearest indicators of revenue loss risk. Every vacant unit represents not just empty space, but lost income, leasing friction, and often additional make ready costs.
Canadian investors should pay close attention to vacancy because CMHC’s Rental Market Survey provides a valuable benchmark across provinces and major centres. The survey tracks vacancy rates, average rents, turnover rates, and unit counts, which makes it one of the most useful external references for rental performance. If your building’s vacancy is far above the local benchmark, that gap deserves explanation. It may reflect weak property execution, incorrect pricing, poor unit condition, or submarket specific softness.
Rent collections
Rent collections track how much billed rent is actually received. This metric matters because booked rent is not the same as collected cash. A building can appear healthy on paper while delinquency quietly erodes liquidity.
For beginners, collections are one of the most practical signals to review every month. If occupancy is strong but collections weaken, it may indicate tenant stress, ineffective follow up, or a policy problem in the payment process. Automated alerts and integrated rent payment systems can improve this dramatically by showing missed payments faster and creating a clearer collections workflow.
Turnover rate
Turnover measures tenant movement, not empty units. CMHC defines turnover as a unit occupied by a new tenant within the past 12 months. This distinction matters because investors often confuse turnover with vacancy, even though the two represent different types of risk.
High turnover increases leasing costs, cleaning and repair expenses, and revenue interruption between tenancies. It can also signal product mismatch. In recent Canadian rental reporting, CMHC noted that turnover was higher among more expensive rent quartiles in many markets, while lower priced units in cities such as Toronto and Vancouver remained relatively tight. That tells investors something important. Different tenant segments behave differently, so performance needs to be tracked by rent band, not only by building average.
Operating expenses
Operating expenses include repairs, utilities, insurance, property taxes, management fees, and day to day costs required to run the asset. Expenses deserve as much attention as revenue because a property can lose performance through cost drift just as easily as through vacancy.
Beginners often underestimate how fast expense creep can compress margins. Insurance repricing, utility volatility, contractor cost increases, or recurring maintenance issues can all reduce operating efficiency. Expense tracking becomes more powerful when categorized consistently and reviewed against prior periods, budget assumptions, and comparable assets.
Net operating income
Net operating income, or NOI, is one of the most important measures in real estate. It represents revenue minus operating expenses, before debt service and taxes. NOI is central because it captures the property’s ability to generate income from operations.
When NOI grows for the right reasons, such as stronger collections, lower controllable expenses, and stable occupancy, the asset is usually improving. When NOI shrinks despite rent growth, the underlying problem may be concessions, vacancy, utilities, payroll, repairs, or tax increases. For beginners, NOI is the metric that forces a more complete view of performance.
Debt service coverage ratio
Debt service coverage ratio, or DSCR, measures how comfortably a property’s income covers its debt payments. It is typically calculated by dividing NOI by debt service. A DSCR above 1.0 means the property generates enough income to pay its financing obligations, while a lower ratio suggests pressure.
This metric is especially important in uncertain markets because it links operations to resilience. A building with softening revenue and rising expenses may still look manageable until debt coverage tightens. Beginners who monitor DSCR monthly can spot stress earlier and make decisions about refinancing, rent strategy, or cost controls before the situation becomes urgent.
Cash on cash return
Cash on cash return measures annual pre tax cash flow relative to the actual cash invested. This is a useful ownership lens because it reflects what the investor is earning on deployed capital, not just what the property earns in theory. It is a practical metric for comparing deals, especially across different financing structures.
For new investors, cash on cash return creates a bridge between property operations and investment outcomes. It translates occupancy, collections, expenses, and debt costs into a return figure that is easier to compare with goals. If returns weaken, the dashboard should help explain why.
Why benchmarking matters more than a single property report
A property report without a benchmark can be misleading. A 4% vacancy rate might look acceptable until you learn the local submarket is sitting at 1.8%. Or a 7% vacancy rate may seem alarming until you realize the broader market has softened sharply and competing properties are in the same range. Benchmarking brings context to raw numbers.
For Canadian rental investors, CMHC is one of the strongest benchmark sources available. Its Rental Market Survey tracks vacancy, average rents, turnover, and unit counts across major markets and provinces. More importantly, it provides a consistent methodology. That consistency is essential when comparing your internal operating data against external market conditions.
Recent data makes the need for benchmarking even clearer. CMHC’s 2025 reporting indicated rising vacancy and turnover across many Canadian markets, while conditions differed significantly by city and by rent quartile. If you only watched one portfolio level average, you could miss the fact that mid priced units are stable while high rent units are seeing more movement. Smart asset tracking should surface those differences.
Benchmarking is also property type specific. Multifamily, office, industrial, and retail respond to different demand drivers. PwC’s outlook showing national office vacancy at 18.7% in Q2 2025 is a good reminder that market conditions cannot be generalized across all assets. A beginner investor who owns apartments should not interpret multifamily KPIs through an office market lens, and vice versa.

How automation improves asset performance tracking
Automation is now a defining feature of modern real estate operations. At the beginner level, it can be as simple as syncing rent payments, expense records, and leasing activity into one dashboard. At a more advanced level, it includes AI assisted forecasting, predictive maintenance alerts, automated delinquency workflows, and real time portfolio reporting.
The real benefit of automation is not speed alone. It is consistency. Automated systems create common data definitions, standard reporting periods, and repeatable calculations across properties. That helps owners trust the output. It also reduces the risk that one asset manager is classifying costs differently from another, or that one site is reporting occupancy on a different basis.
Industry research has pointed to AI, automation, common data, and digital platforms as major themes shaping real estate operations and asset servicing. In practical terms, that means more investors are moving from reactive management to proactive oversight. Instead of discovering a maintenance backlog after renewal rates slip, a smart system can connect work order volume, equipment downtime, and tenant complaints before occupancy is affected.
Automation also changes the speed of decision making. If expense creep is visible only in quarterly reviews, owners lose valuable time. If it is visible weekly or daily through integrated systems, the response can be faster and more precise. This is where automation stops being a convenience and becomes a financial control tool.
Examples of useful automation for beginners
Not every investor needs advanced AI on day one. The best starting point is practical automation that removes repetitive manual work and improves data quality. That often includes bank feed integration, automatic rent roll updates, digital leasing workflows, recurring monthly KPI reports, maintenance ticket tracking, and alert systems for late payments or abnormal expenses.
These tools help even small owners operate with more discipline. A property with ten units can benefit from the same principles as a larger portfolio. What changes is scale, not logic. The key is to choose systems that reduce manual entry and make it easier to compare expected performance with actual results.
Building a simple monthly KPI dashboard
A beginner friendly dashboard does not need to be complicated. In fact, simpler is usually better. Your goal is to build a monthly operating view that tells you whether income is stable, costs are controlled, debt obligations are covered, and tenant behavior is changing in ways that affect risk or upside.
A strong dashboard usually includes the following sections:
- Revenue indicators such as occupied units, asking rent, achieved rent, collections, concessions, and bad debt.
- Leasing indicators such as vacancy rate, turnover rate, days to lease, renewals, and move in or move out counts.
- Expense indicators such as utilities, repairs and maintenance, payroll or management costs, insurance, and taxes.
- Profitability indicators such as NOI, NOI margin, and budget variance.
- Financing indicators such as debt service, DSCR, and cash flow after financing.
- Asset health indicators such as maintenance backlog, open work orders, capex projects, and utility consumption trends.
What makes a dashboard useful is not just the numbers. It is the comparison structure. Each KPI should be shown against prior month, prior year, budget, and benchmark where possible. That allows you to tell whether a change is temporary, seasonal, operational, or market driven.
For example, if turnover rises while the local market also shows increased mobility in higher rent quartiles, your issue may be partly structural. If turnover rises in your building while local comparables remain stable, your issue may be pricing, service quality, or unit condition. The dashboard is most powerful when it helps you ask the right second question.
Separating market signals from property signals
This is one of the most important habits in asset performance tracking. Not every weak result is the property’s fault, and not every strong result proves great management. Sometimes a building is lifted by favorable local demand. Sometimes it is dragged by a soft submarket. The job of performance tracking is to separate those effects.
A useful approach is to review performance at three levels every month. Start with the property level, where you look at occupancy, collections, expenses, and NOI. Then move to the submarket level, where you compare rents, vacancy, and turnover against local conditions. Finally review the portfolio or strategic level, where you consider financing exposure, capital plans, and return targets.
This layered approach prevents common analytical mistakes. One of the biggest is assuming a portfolio average tells the whole story. It does not. A single portfolio wide occupancy number can hide a weak property, a stressed rent tier, or a segment that is becoming more volatile. The more granular your view, the better your decisions tend to be.
Recent Canadian market trends support this approach. CMHC’s reporting has highlighted meaningful variation across Toronto, Vancouver, Calgary, Edmonton, Montréal, Halifax, and Ottawa, as well as across price bands. That means the same operating strategy will not fit every building. Tracking performance by submarket and tenant segment is no longer optional for serious investors.
The growing role of smart building and energy data
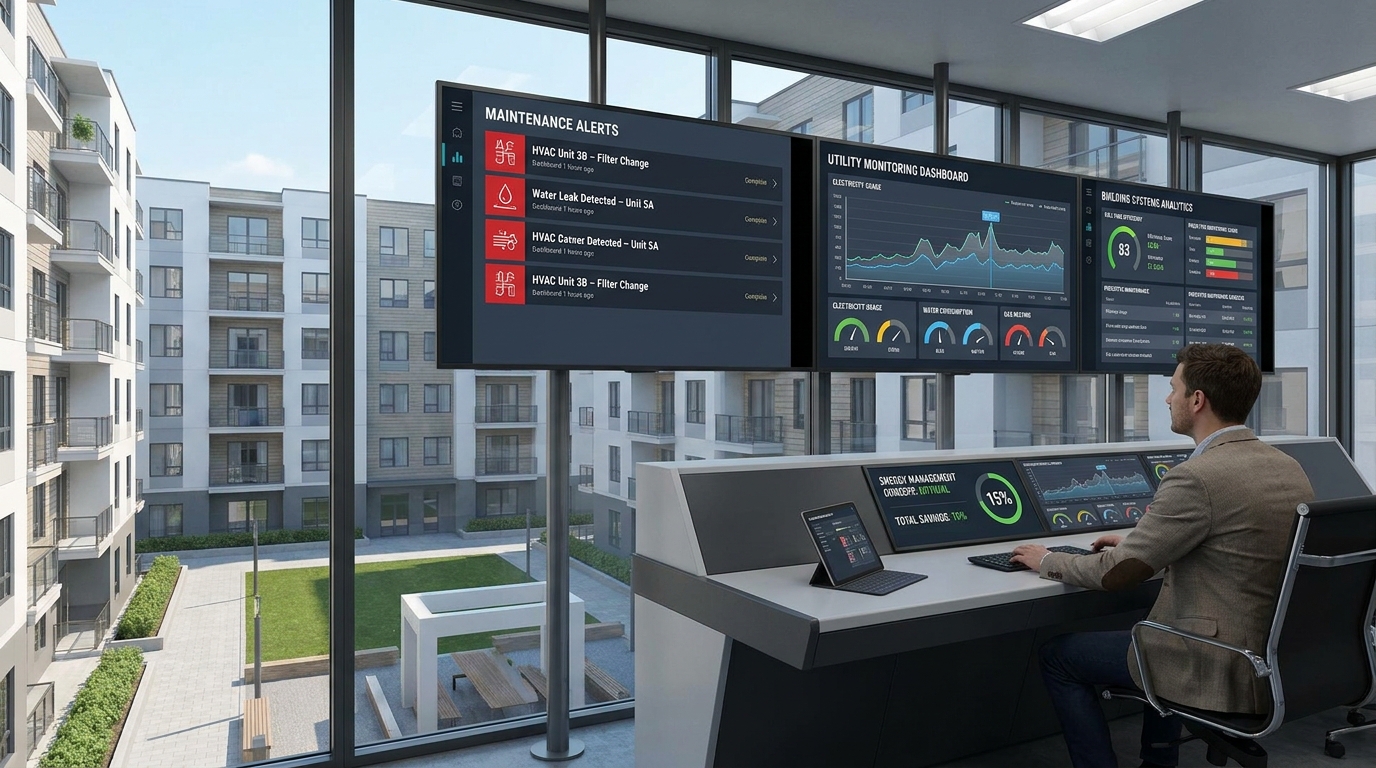
Asset performance is no longer limited to rents and repairs. Building systems themselves are becoming part of the investment intelligence stack. Smart meters, HVAC monitoring, leak detection, equipment sensors, and utility analytics can reveal cost patterns that traditional financial statements show only after the damage is done.
This matters because utilities and maintenance are major components of operating performance. If energy use rises unexpectedly, the issue may be equipment inefficiency, tenant usage patterns, poor insulation, or operational timing. If a boiler is showing signs of failure, predictive maintenance data can reduce downtime, avoid emergency replacement costs, and improve tenant satisfaction.
There is also a strategic layer here. Across North America, climate conditions, regulations, and tenant expectations are increasing pressure on owners to manage building efficiency more seriously. Better energy tracking can support lower operating costs, longer equipment life, and stronger reporting transparency. For beginners, this may sound advanced, but even basic utility monitoring can improve NOI over time.
Common mistakes beginners make when tracking performance
Most tracking mistakes are not about effort. They are about framing. New investors often watch the visible numbers and miss the connecting signals underneath. The good news is that these mistakes are easy to correct once you know what to look for.
- Confusing occupancy with performance. A full building can still underperform if rents are under market, collections are weak, or concessions are too generous.
- Treating vacancy and turnover as the same thing. Vacancy measures empty available units, while turnover measures tenant movement. Both matter, but they tell different stories.
- Using inconsistent definitions across properties. If metrics are not calculated the same way every month, trend analysis becomes unreliable.
- Relying entirely on manual spreadsheets. Manual reporting increases lag, formula risk, and data inconsistency, especially as portfolios grow.
- Ignoring submarket context. A weak result may be market driven, property specific, or segment specific. You need benchmarks to know which.
- Focusing only on revenue. Expenses, debt coverage, capex needs, and building system performance all affect real returns.
The unifying lesson is that performance tracking should be connected. Revenue, operations, financing, and asset condition all influence one another. When investors monitor them separately, they often react too late. When they track them as one operating system, patterns become visible much earlier.
A practical workflow for new investors
If you are wondering how to put all of this into action, start small and build consistency before complexity. The best first step is to create a monthly review process that uses one source of truth for each property. That source should combine accounting data, leasing activity, rent collections, and maintenance information as cleanly as possible.
From there, follow a simple workflow each month:
- Update rent roll, collections, expenses, and occupancy from your operating systems.
- Calculate your core KPIs, including vacancy, turnover, NOI, DSCR, and cash on cash return.
- Compare results against budget, prior month, prior year, and local benchmark data such as CMHC reports.
- Flag any meaningful variance and identify whether it is revenue related, expense related, financing related, or asset condition related.
- Assign an action, such as repricing units, tightening collections, investigating repair trends, or reviewing capital planning.
- Document findings so trends are visible over time and not forgotten after one meeting.
This process sounds basic, but it creates discipline. Most performance improvement in real estate does not come from dramatic one time insight. It comes from consistent review, better data, and faster response. That is exactly where automation compounds value.
How data driven tracking supports better investment decisions
Asset performance tracking is not just an operating exercise. It directly improves acquisition underwriting, refinancing strategy, risk management, and capital planning. When you understand what drives NOI, turnover, collections, and debt coverage at the property level, you become better at estimating future performance during a purchase.
It also improves communication. Lenders, partners, and stakeholders respond better to owners who can explain trends clearly with data. Instead of saying expenses feel higher, you can show that utilities rose 11% year over year, turnover increased in the highest rent tier, and NOI pressure is linked to slower leasing velocity rather than a full market collapse. That level of clarity supports better financing conversations and more credible decision making.
For portfolio owners, tracking also improves capital allocation. If one building has stable collections but aging systems, capex may produce durable value. If another has rising vacancy and weak renewals despite fresh upgrades, the issue may be positioning rather than deferred maintenance. Data helps prevent capital from being deployed based on assumption alone.
In that sense, asset performance tracking becomes a strategic advantage. It helps investors see risk sooner, underwrite more carefully, and operate with less guesswork. That is increasingly important in a market where conditions can diverge sharply by city, property type, and tenant segment.
Final thoughts
For beginners, the idea of tracking asset performance can seem like something reserved for institutional investors. It is not. At its core, it is simply the habit of measuring whether a property is doing what you need it to do. Is income stable? Are costs under control? Is financing covered? Are tenants staying? Is the building getting stronger or more fragile over time?
The modern difference is that owners now have better tools to answer those questions. Integrated platforms, automated reporting, digital leasing, maintenance systems, and smart building analytics make performance tracking more accessible than it used to be. The point is not to drown in data. The point is to build a cleaner operating picture so that decisions become faster and more accurate.
If you are just getting started, begin with a monthly KPI dashboard and a consistent set of definitions. Track occupancy, vacancy, collections, turnover, expenses, NOI, DSCR, and cash on cash return. Compare your numbers against market benchmarks such as CMHC’s rental data and against your own historical trends. Then automate whatever you can so the system becomes easier to maintain as your portfolio grows.
Real estate rewards owners who can see clearly. In a changing market, visibility is not a luxury. It is performance infrastructure. The investors who build that infrastructure early are usually the ones who make better decisions later.



No Comment! Be the first one.