
Toronto’s Transit Zones Are Absorbing the City’s Density, and the Data Proves the Strategy Works
Every so often a city produces a dataset that confirms what planners have argued for years: put density where the infrastructure already exists, and growth follows. New figures from UrbanToronto’s UTPro service on Toronto’s Major Transit Station Areas do exactly that, and for anyone thinking about where long term housing value and development opportunity in this city is heading, the numbers deserve a close read.
Major Transit Station Areas, the zones within roughly a ten minute walk of subway, GO, or light rail stations, now hold 895 of Toronto’s 1,830 pre-construction projects, just shy of half. But scale tells the real story. Those projects account for 496,328 of the proposed units in the city, compared with 350,094 outside MTSA boundaries. Put plainly, 48.9 percent of projects are generating 58.6 percent of the proposed homes. That is not a marginal difference. That is a structural shift in where Toronto’s housing supply is being built.
The physical contrast between what gets built inside and outside these zones is just as telling. Projects within MTSAs average 105.2 metres and 30.2 storeys, roughly double the height of projects elsewhere in the city at 51.7 metres and 14.7 storeys. Floor area runs 44 percent higher inside MTSA boundaries. And parking ratios, long a proxy for how a project is designed around transit versus around the car, sit at 0.51 spaces per unit inside MTSAs versus 0.77 outside. Under construction projects show the same pattern, with an active pipeline of 192 MTSA projects delivering 65,403 units against 49,682 units from 160 projects beyond them.
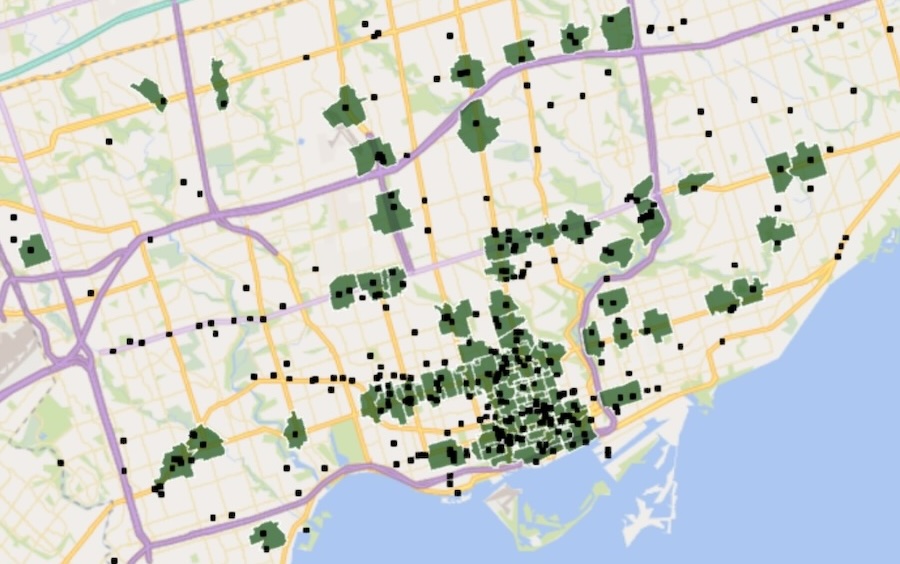
For developers and city builders, this is the clearest validation yet of the policy logic behind MTSA zoning. When permissive height and density rules are paired with real transit access, capital follows, and it follows at a scale outside projects simply cannot match. That said, the data also flags something worth watching: total project counts outside MTSAs, at 935, have edged ahead of the 895 inside them this year, a slight reversal from 2025. Growth is not abandoning the rest of the city. It is simply concentrating its intensity, its height, and its unit volume inside the transit envelope while spreading more broadly, but more modestly, everywhere else.
Strong projects are built from a wider understanding of timing, access, infrastructure, policy, and demand, and MTSAs are now proving that thesis at scale.
What this means for anyone evaluating land near a transit node is straightforward. Sites inside an MTSA carry a planning advantage that translates directly into buildable density, and that advantage is widening, not narrowing, year over year. For a city still working through a housing supply gap, the lesson from this data is not that MTSAs are a nice idea. It is that they are, right now, the single most productive lever Toronto has for turning zoned land into actual homes.
Source: UrbanToronto, “Density Coming to Toronto’s MTSAs… But More Projects Beyond Them”