What Days-on-Market Data Is Really Telling GTA Investors Right Now
Liquidity is the metric too many buyers ignore until it costs them. New figures from digital real estate platform Wahi on the Greater Toronto Area show just how wide that liquidity gap has become, and for investors, the spread between a 10-day sale and a 77-day sale is not a curiosity. It is a signal about where capital is being rewarded and where it is stuck waiting.
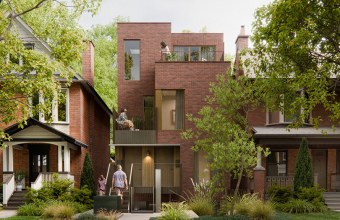
According to the data, Alderwood in Etobicoke led the region in July with homes averaging just 10 days on the market. Palmer in Burlington followed at 15 days, with Uptown Ajax and Dovercourt Park in Toronto both averaging 16. The common thread across the fastest-moving neighbourhoods, as Wahi economist Ryan McLaughlin put it, is a certain type of product: family-friendly, move-in ready, single-family or row homes. Buyers are not looking for renovation projects right now. They want to close and move in.
That preference has direct implications for portfolio positioning. Move-in ready family housing in accessible, well-located pockets is behaving like the most liquid asset class in this market. For an investor thinking about resale timelines, financing costs, and carrying risk, liquidity like that reduces exposure. A property that sells in two weeks is a property that is not bleeding holding costs while rates and policy remain uncertain.
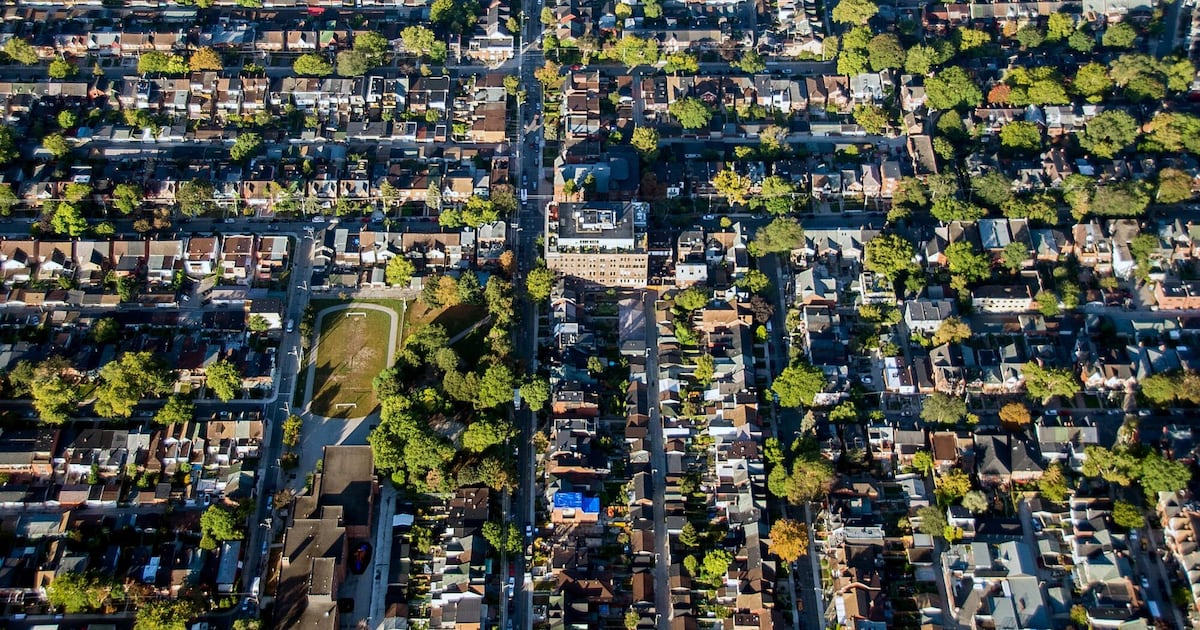
On the other end sits a very different opportunity, and a very different risk. Chaplin Estates in midtown Toronto averaged 77 days on market, the slowest in the region, followed by Tansley Woods in Burlington at 71 and Bronte Lakeshore in Oakville at 65. McLaughlin was direct about the cause: the GTA is being dragged down by condos, and smaller units in particular. He called them, without much softening, shoebox apartments that are really struggling. That is a segment carrying real oversupply risk as new condo completions continue to hit the market.
Has this market finally suffered enough?
That question, posed by McLaughlin himself, is the one every disciplined investor should be sitting with. The gap between fastest and slowest actually narrowed from June, when the quickest neighbourhood averaged six days and the slowest 126. That compression could mean the broader market is inching toward balance, consistent with TRREB’s recent note that fewer owners are listing, a dynamic that tends to firm up pricing over time. But 2025 also produced the lowest annual GTA sales total since 2000, a reminder that demand has not fully returned even as supply pressure eases in some corners.
For investors, the read here is not to chase the fastest-selling neighbourhoods blindly, nor to write off the slowest ones entirely. It is to separate the segments. Family-oriented, move-in ready housing in accessible communities continues to show pricing power and liquidity, which supports both resale strategies and rental demand from tenants who want the same qualities buyers do. The condo segment, meanwhile, still needs to work through excess supply before it becomes a value opportunity rather than a value trap. Patient capital watching completion schedules and absorption rates in that segment may find the better entry point still lies ahead, not now.
Timing, product type, and location remain the three variables that separate a good real estate decision from an average one. This data does not change that formula. It simply makes the current gaps in the GTA market impossible to ignore.
Source: CP24