


How to Monitor Your Solar System’s Performance Effectively
Installing solar panels is a meaningful step toward lower utility costs and a more resilient home, but the work does not end once the system is turned on. One of the most practical things a homeowner can do after installation is monitor performance regularly. This is not about becoming an engineer or learning complex electrical terms. It is about building a simple habit that helps you see whether your system is producing as expected, whether your savings are lining up with reality, and whether a small issue is starting to turn into a larger one.
Table Of Content
- Why Monitoring Matters More Than Most Homeowners Expect
- Start With the Right Monitoring Tools
- Know What “Normal” Looks Like for Your System
- Seasonal variation is not a problem by itself
- Create a Simple Monitoring Routine You Can Actually Keep
- What Data Should You Pay Attention To?
- How to Interpret Common Changes in Solar Output
- Cloudy weather and smoke
- Heat waves
- Winter cold
- Snow cover
- Shading from trees or new obstructions
- Dirt and soiling
- Signs That May Point to a Real Problem
- Use Production and Consumption Data Together
- How Net Metering Fits Into the Picture
- When to Clean, When to Wait, and When to Call a Pro
- Monitoring for Warranty Protection and Long Term Planning
- Common Misconceptions to Let Go Of
- A Simple Homeowner Checklist for Ongoing Solar Monitoring
- Final Thoughts
Many homeowners assume that if the lights are on and the power bill looks a little lower, everything must be fine. In practice, solar systems can underperform quietly for weeks or even months if no one is paying attention. A tripped inverter, a new source of shade, a snow covered section of the array, or an app that stopped syncing can all affect your results. Effective monitoring gives you a way to catch those changes early, often before they become expensive or frustrating.
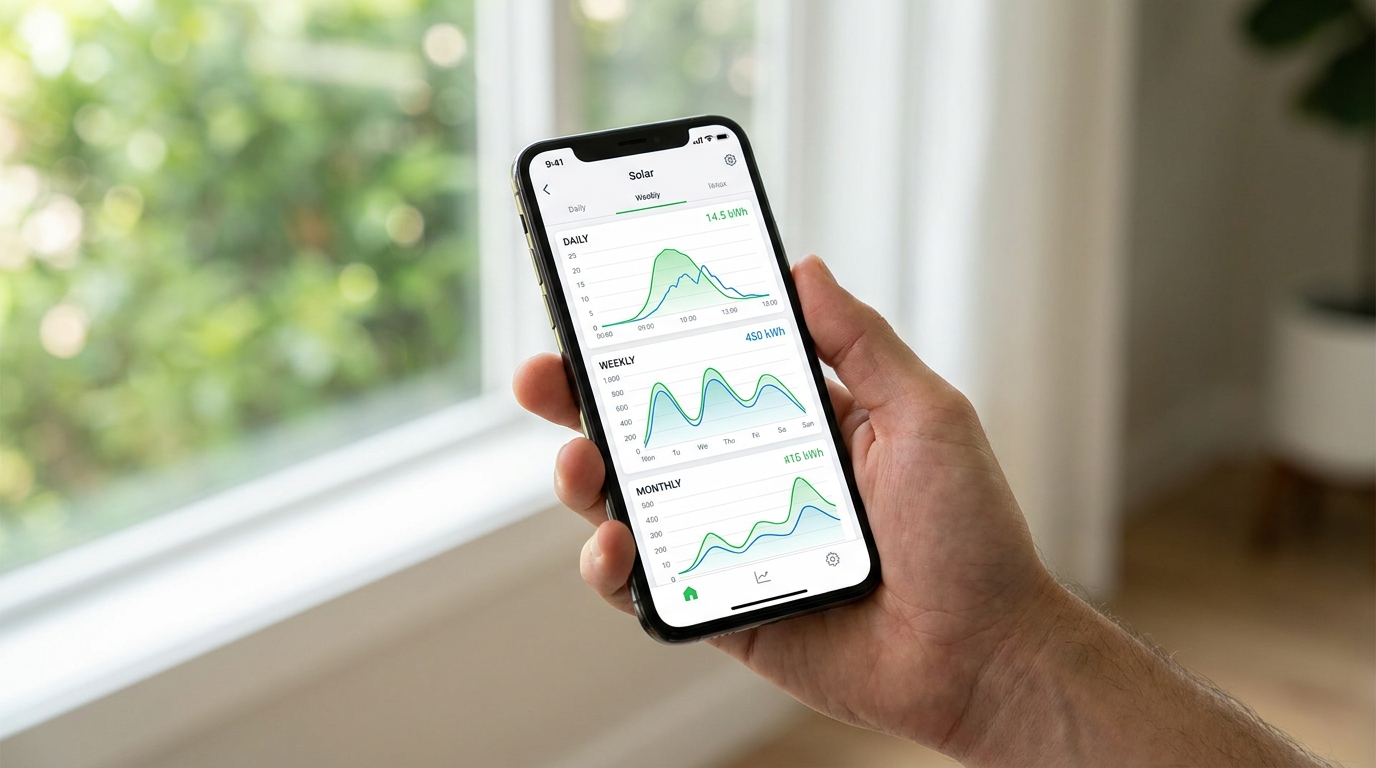
The good news is that modern solar monitoring is more accessible than ever. Most residential systems now include an inverter portal or mobile app that translates production data into easy to understand charts. Some systems also show household consumption, grid imports, and electricity exports through net metering. As guidance from Natural Resources Canada and best practices from NREL suggest, homeowners benefit most when they have access to monitoring instructions, login details, and a simple benchmark for expected system output.
This article focuses on a calm, practical approach. You do not need to calculate advanced efficiency ratios every weekend. What you need is a clear baseline, a few consistent checkpoints, and an understanding of what normal variation looks like across weather, seasons, and household energy use. Once that routine is in place, monitoring becomes just another part of sensible home maintenance, much like checking a furnace filter or watching for leaks around windows.
Why Monitoring Matters More Than Most Homeowners Expect
Solar systems are designed to work quietly in the background, which is one reason they are so appealing. Yet that same quiet reliability can make it easy to miss performance issues. If your inverter goes offline for part of a week or a breaker trips after a storm, there may be no dramatic warning sign inside the house. Your appliances still run because the grid continues to supply electricity when needed. Unless you check the monitoring data, you might not realize your system stopped producing at its usual level.
Regular monitoring protects both short term savings and long term system value. A solar array is a significant investment, and like any investment, it deserves a basic level of oversight. If your system consistently produces less energy than expected, the difference can affect your annual savings, your payback period, and even your ability to support a warranty claim later. Keeping a record of production trends helps you show when a change started and whether it appears linked to equipment, weather, or a site condition like shading.
Monitoring also helps separate generation issues from consumption issues. This distinction matters because many households assume a disappointing bill must mean the panels are underperforming. Sometimes the opposite is true. The solar system may be doing exactly what it should while household electricity use has increased because of air conditioning, a new electric vehicle, space heaters, or simply more time spent at home. Systems that show both production and whole home consumption are especially helpful because they give a fuller picture of what is happening.
Practical takeaway: A lower bill does not automatically prove your solar system is performing perfectly, and a higher bill does not automatically mean the system has failed. Monitoring helps you understand the difference.
Start With the Right Monitoring Tools
For most homeowners, the best place to begin is the monitoring platform that came with the solar installation. In many residential systems, this is provided through the inverter manufacturer. The app or web portal usually shows current power output, daily energy production, and historical views by week, month, or year. Some platforms also send alerts if the inverter disconnects, if production falls below a threshold, or if communication with the system is interrupted.
If you have not logged into your monitoring platform recently, or if you were never given access at installation, this should be your first action item. NREL best practices support giving homeowners monitoring instructions, benchmark data, documentation, and login credentials. Ask your installer for those details if they were not clearly provided. A monitoring tool is only useful if you can access it comfortably and understand what you are looking at.
Your utility may also offer an online portal, particularly if your home uses net metering. This kind of portal is different from the inverter app. The inverter app typically shows what the solar system produced. The utility portal often shows what electricity was imported from the grid and what electricity was exported back to it. Looking at both sources together can help you understand whether you are using most of your solar generation directly, sending excess energy out during the day, or relying heavily on grid electricity in the evening.
If your system includes a dedicated consumption monitor, that adds another useful layer. Consumption monitoring can show how much electricity your home is using in real time and over longer periods. For households trying to improve self consumption or manage costs, this can be just as valuable as knowing how much solar energy the panels generated. It can reveal whether daytime loads are aligned with solar production or whether evening demand is driving higher grid use.
Know What “Normal” Looks Like for Your System
One of the most important ideas in solar monitoring is that performance should be judged relative to conditions. There is no single magic number that your system should hit every day of the year. Output naturally varies based on location, roof orientation, tilt, weather, day length, and temperature. Natural Resources Canada notes that PV potential differs by Canadian location and that orientation and tilt meaningfully affect expected production over time.
This is why the first year of operation is so valuable. It gives you a real world baseline for your specific roof, climate, and household pattern. Instead of asking whether today’s output seems high or low in isolation, you can compare this June to last June, this sunny week to a similar sunny week, or this winter month to the same period in the prior year. Homeowners often benefit more from this baseline approach than from trying to interpret advanced technical metrics.
A useful starting benchmark can include the following:
- Your average production by month during the first full year.
- Your best and worst production months.
- Your typical daily pattern on a clear day.
- Your normal winter behavior, especially if snow is common in your area.
- Your usual relationship between solar production and household electricity use.
Once you have those reference points, changes become easier to spot. If a July month that should be one of your strongest suddenly looks weak compared with previous summers, that deserves attention. If output is a bit lower during a smoky week, a heat wave, or several cloudy days, that may be completely normal. Trend monitoring is more useful than reacting to a single reading.
Seasonal variation is not a problem by itself
Many new solar owners are surprised by how much output shifts across the year. In Canada and similar northern climates, long summer days can generate far more energy than short winter days. That does not mean the system is failing in winter. It reflects day length, sun angle, snow cover, and weather patterns. Comparing January to July is not particularly helpful. Comparing this January to a previous January is much more meaningful.
Another misconception is that cold weather always hurts solar performance. In reality, photovoltaic cells generally perform better at lower temperatures. Cold air alone does not necessarily reduce panel efficiency. What often matters more in winter is whether snow is covering part of the array, whether the sun angle is lower, and whether short days simply leave fewer production hours available. Understanding this distinction can help homeowners avoid drawing the wrong conclusion when winter production drops.
Create a Simple Monitoring Routine You Can Actually Keep
The most effective monitoring routine is one that feels sustainable. It should not depend on technical skill or a large time commitment. A quick check a few times per week, combined with a deeper review each month, is often enough for a homeowner to stay informed and catch common problems early. The goal is consistency, not obsession.
A practical routine might look like this:
- Check the app briefly every few days to confirm the system is reporting data.
- Look at daily production and compare it to recent weather conditions.
- Review weekly or monthly totals to identify unusual dips.
- Check for alerts, error messages, or gaps in reporting.
- Cross reference solar production with your utility or consumption data once a month.
- Do a visual inspection from the ground after major storms, heavy snowfall, or nearby tree growth.
This kind of routine is not complicated, but it is powerful. A brief check can tell you whether the inverter is online, whether production is in the expected range, and whether something changed suddenly. The monthly review gives you more context and helps you avoid overreacting to routine weather swings. Over time, these small habits create a clear record of normal system behavior.
Some homeowners like to keep a simple spreadsheet or notebook with monthly totals and short notes about unusual events. You might note a week of snow accumulation, a period of wildfire smoke, a tree that was trimmed, or an inverter restart after utility work. These notes can be surprisingly useful later if you are trying to understand why production shifted or if you need to discuss a warranty issue with an installer.
What Data Should You Pay Attention To?
Most monitoring apps offer more information than the average homeowner truly needs. That can make the dashboard feel intimidating at first. The key is to focus on the few indicators that are most useful for day to day oversight. You do not need to interpret raw electrical signals to know whether the system is healthy.
The most practical data points to watch are:
- Current power output: Useful for confirming that the system is active during sunny hours.
- Daily energy production: Helps you see whether today is roughly in line with the weather.
- Weekly and monthly totals: Better for spotting true trends and persistent underperformance.
- System status and alerts: Important for identifying communication failures or inverter faults.
- Household consumption: Helps explain why savings may not match generation.
- Grid imports and exports: Useful for understanding net metering results and self consumption patterns.
Some systems also reference performance ratio or expected versus actual output. These tools can be helpful, especially as fault detection becomes more accessible, but homeowners do not need to rely on them exclusively. The clearest warning sign is often a sustained drop in output compared with your own historical baseline. NRCan guidance supports that idea by emphasizing that measured output should be considered alongside conditions such as irradiance and panel temperature, rather than treated as a simple standalone number.
How to Interpret Common Changes in Solar Output
Solar performance naturally moves up and down, so the real skill is learning which changes are normal and which deserve action. This becomes much easier when you compare output against recent weather, time of year, and your own history. A single cloudy day tells you almost nothing by itself. A steady decline over several bright weeks is a very different story.
Cloudy weather and smoke
If production falls during a cloudy stretch or when there is significant smoke in the air, that is usually expected. Solar panels still produce electricity in diffuse light, but much less than they do under direct sun. What matters is whether output returns to normal once conditions improve. If it does, there is usually no cause for concern.
Heat waves
Homeowners are often surprised to learn that very hot weather can slightly reduce solar panel performance. Panels do not necessarily perform best on the hottest days. They generally operate more efficiently when they are cool, even if sunlight is strong. If production on a heat wave day seems a bit lower than on a clear, mild day, that can be normal.
Winter cold
Cold weather itself is not usually the enemy. As noted earlier, PV cells often perform well at lower temperatures. The bigger winter concerns are shorter days, lower sun angles, snow cover, and potential shading from nearby structures or trees. If your system produces less in winter than in summer, that is expected. If it produces almost nothing for an extended period while conditions seem reasonable, you should investigate further.
Snow cover
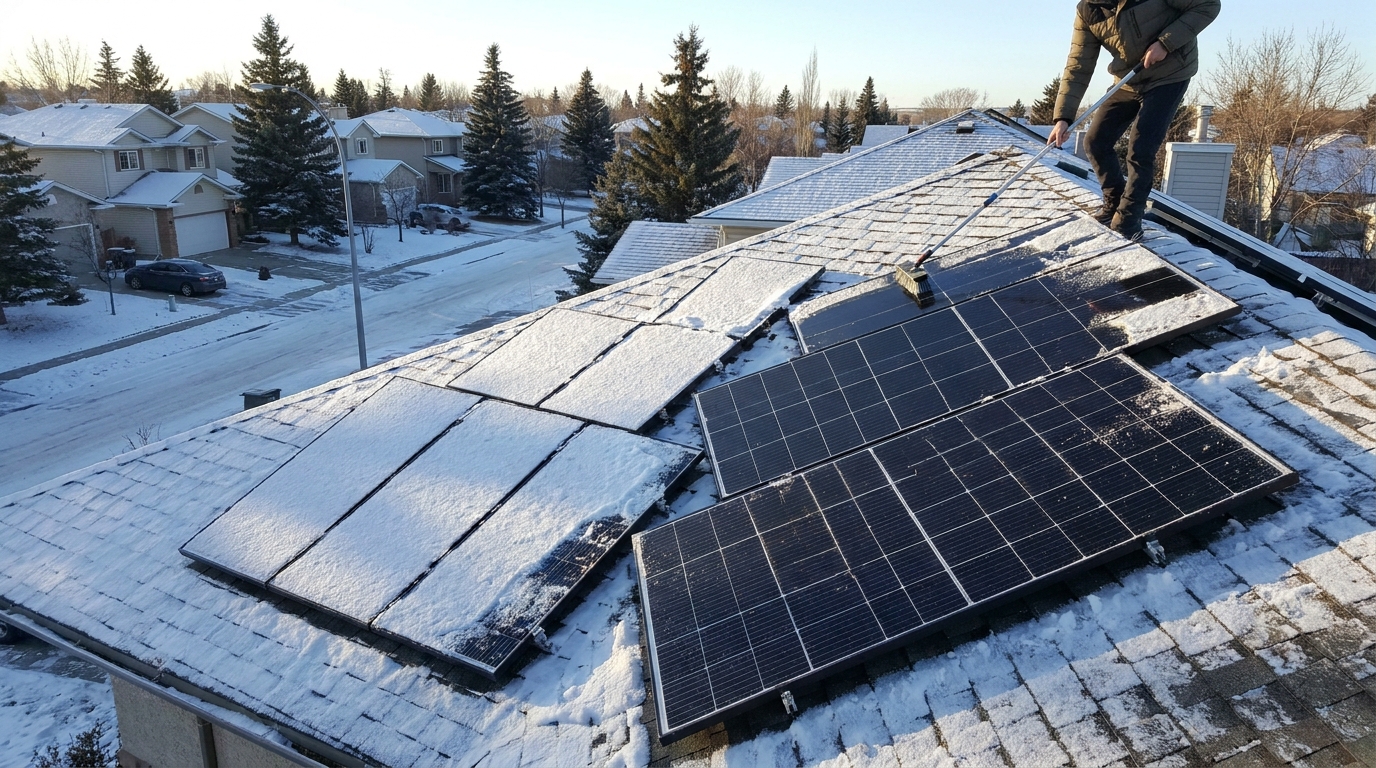
Snow can have a major effect if it remains on the panels and blocks light. In many cases, snow will slide off as the panels warm in sunlight, especially on steeper roof slopes. Homeowners should be cautious about removal. Safety comes first, and climbing onto an icy roof is never worth the risk. If you can safely observe the array from the ground and see partial or full snow coverage persisting, that may explain temporary underperformance.
Shading from trees or new obstructions
Shading is one of the most common reasons for gradual output loss. Trees grow, neighboring structures change, and even a new vent or satellite placement can affect exposure. If your monthly numbers decline over time rather than suddenly, especially during otherwise favorable seasons, shading is worth checking. A visual inspection from the ground can reveal whether tree canopies are casting longer shadows than they did in earlier years.
Dirt and soiling
Dust, pollen, leaves, and bird droppings can reduce production, but homeowners often overestimate the impact of routine dirt. In many regions, normal rain does a reasonable job of cleaning panels. If you notice obvious buildup or have gone through a very dry period, soiling may be a factor, but cleaning too frequently is not always necessary. Focus on visible issues and production trends rather than assuming every small dip is caused by dirt.
Signs That May Point to a Real Problem
While some variation is normal, certain patterns deserve closer attention. The most important red flag is a sudden and sustained drop compared with historical performance or expected seasonal levels. If your system typically produces well on clear days and then starts producing far less with no obvious weather explanation, it is time to investigate.
Watch for these warning signs:
- Production falls sharply and stays low for several days or weeks.
- The monitoring app shows the inverter is offline or not communicating.
- There are repeated fault or warning alerts in the system dashboard.
- One part of the system appears inactive if module level monitoring is available.
- Your utility exports fall unexpectedly during a season when they are usually strong.
- Production data has missing gaps that cannot be explained by internet issues alone.
If you notice one of these patterns, start with simple checks before assuming major equipment failure. Verify that the monitoring platform itself is functioning. Occasionally, the solar system is fine but the app has lost its connection to the internet. Check whether the inverter display shows normal status. Look for any obvious physical issue visible from the ground, such as heavy debris, snow coverage, or new shading.
If the issue persists and you cannot identify a clear external cause, contact your installer or service provider. Being able to describe when the change started, how large it appears to be, and whether there were any recent site changes will help them diagnose the problem more efficiently. This is another reason consistent monitoring is so valuable. It gives professionals useful context rather than just a vague sense that savings seem off.
Use Production and Consumption Data Together
One of the most helpful trends in residential solar monitoring is the move toward dashboards that combine generation and household electricity use. This matters because savings are not based only on how much power the panels produce. They are also shaped by when your household consumes electricity. A home that uses a lot of energy in the evening may still draw heavily from the grid even if the solar array performs well during the day.
By looking at both production and consumption, you can answer more useful questions. Are you using large appliances during sunny hours when solar production is highest. Are you exporting a lot of energy at midday and buying it back later in the evening. Did a new appliance, electric heater, or vehicle charger change your electricity profile more than you expected. These insights can improve the financial value of your system without changing the hardware at all.
For example, if you see strong daytime production but modest bill savings, your solar system may not be the problem. The issue may be timing of use. Shifting some flexible loads to the middle of the day can increase self consumption and reduce grid imports. Running the dishwasher, doing laundry, or charging certain devices during solar hours can make a noticeable difference over time.

How Net Metering Fits Into the Picture
Net metering can make solar economics easier for homeowners, but it can also create confusion when people try to monitor performance using the bill alone. Your utility statement reflects the relationship between what you consumed from the grid and what you exported back to it. It does not always tell the full story of what the solar system generated directly for use in the home.
This is why the utility portal and inverter app should be seen as complementary tools. The inverter app usually tells you how much the solar array produced. The utility account tells you how much energy crossed the boundary between your home and the grid. If you rely on the bill alone, you may overlook underperformance or misunderstand a change in savings caused by higher household demand.
As a practical habit, compare monthly solar production from your inverter app with monthly utility import and export figures. Over time, this cross check helps you understand your system in a more complete way. It can also reveal whether the utility data and the inverter data generally align with your expectations, which is useful if something starts to look unusual.
When to Clean, When to Wait, and When to Call a Pro
Cleaning is one of the most misunderstood parts of solar maintenance. Some homeowners worry that any visible dust must be cutting deeply into production. Others assume cleaning is always unnecessary. The truth sits comfortably in the middle. Light dust and pollen are often not a major issue, especially in climates with regular rain. Heavy soiling, sticky debris, or accumulations after long dry periods can matter more.
Before doing anything, consider safety and warranty guidance. Roof access can be dangerous, and some manufacturers or installers may recommend specific cleaning methods. Harsh tools, abrasive scrubbing, or pressure washing can damage equipment. If the panels appear heavily soiled and production has dropped without another obvious cause, ask your installer what approach is appropriate for your system.
Snow removal deserves similar caution. In snowy regions, homeowners naturally want to restore winter output quickly, but climbing onto a roof with snow and ice is not advisable. In many cases, waiting for natural shedding is the safest choice. If snow cover remains and the system is inaccessible or performance concerns persist, speak with a qualified service provider rather than improvising a risky solution.
Monitoring for Warranty Protection and Long Term Planning
Monitoring is not just about today’s bill. It also creates a performance record that can support future maintenance, resale conversations, and warranty claims. If a component begins underperforming, a history of production data makes it easier to show when the issue started and how persistent it has been. This can help streamline discussions with installers, manufacturers, or insurers after an event such as severe weather.
It is wise to keep a small digital folder with your installation documents, warranty information, inverter login details, and screenshots or exports of annual production summaries. NREL emphasizes the importance of giving owners benchmark data and documentation, and homeowners benefit when that information is easy to find. You do not need a sophisticated recordkeeping system. A simple, organized folder is enough.
Longer term monitoring can also help you make smarter home energy decisions. If you are considering adding an electric vehicle, heat pump, battery, or induction range, your existing solar and consumption patterns provide a valuable foundation. Knowing how much energy the home currently produces and uses helps you plan upgrades with more confidence.
Common Misconceptions to Let Go Of
A calmer, more accurate view of solar monitoring begins by releasing a few common myths. The first is that solar panels should produce the same amount every day. They should not. Output changes with weather, season, daylight hours, and site conditions. Consistency in a solar system does not mean identical daily numbers. It means predictable performance relative to conditions.
The second myth is that winter cold always reduces performance. Cold weather can actually support better panel efficiency. It is often snow, low sun angle, and shorter days that limit winter production, not cold air by itself. This distinction helps homeowners interpret winter data more realistically.
The third myth is that a lower bill proves the system is working perfectly. Bills are influenced by both generation and consumption, along with rate structures and timing. A useful monitoring routine looks beyond the bill to the actual production data. That gives you a clearer picture of system health.
The final myth is that monitoring is only for technical users. In reality, monitoring is one of the most homeowner friendly ways to protect a solar investment. You do not need to understand engineering formulas to notice that a strong summer month suddenly looks weak or that the inverter app has stopped reporting. Practical attention is often enough.
A Simple Homeowner Checklist for Ongoing Solar Monitoring
If you prefer to keep things straightforward, the checklist below captures the essentials of effective solar monitoring without unnecessary complexity:
- Make sure you have the inverter app login, installer contact information, and system documentation.
- Review your system dashboard a few times each week during daylight hours.
- Check that production data is being recorded consistently.
- Compare monthly production against your baseline and the same month in prior years.
- Cross check solar generation with utility or net metering data.
- Pay attention to sustained drops, not one off cloudy day readings.
- Inspect visible conditions from the ground after storms, snowfall, or tree growth.
- Record unusual events such as smoke, heavy snow, or utility outages.
- Contact a professional if the system remains underperforming without a clear explanation.
This kind of checklist is intentionally modest. It reflects the reality that good monitoring is mostly about awareness, pattern recognition, and timely follow through. Most homeowners do not need more than that to keep their system on track.
Final Thoughts
Monitoring your solar system effectively is less about technical analysis and more about building a steady, practical habit. The best approach is simple. Use the tools you already have, understand what normal seasonal variation looks like, compare trends over time, and pay attention to sustained changes. That is usually enough to catch common issues early and keep your savings moving in the right direction.
There is something reassuring about solar when it becomes part of the rhythm of everyday home care. A quick glance at the app, a monthly review of production, and an occasional comparison with utility data can turn a complex sounding technology into something quite manageable. It helps you stay connected to how your home performs without making the experience feel burdensome.
For homeowners who want solar to feel accessible, that is really the point. You do not need to monitor perfectly. You only need to monitor consistently. Over time, that consistency gives you confidence, protects your investment, and makes clean energy at home feel not only sustainable, but genuinely practical.



No Comment! Be the first one.