



Rental analytics sounds technical at first, but the idea is surprisingly practical. It simply means using housing data to understand how rental properties perform, how much demand exists, where rents are moving, and how affordability is changing. In a market where prices, supply, and neighborhood conditions can shift quickly, data helps replace instinct with evidence.
Table Of Content
- What Rental Analytics Actually Means
- The Core Metrics Every Beginner Should Understand
- Vacancy Rate
- Availability Rate
- Turnover Rate
- Average Rent and Rent Change
- Rent-to-Income Ratio
- Net Operating Income and Cash Flow
- Cap Rate and Comparable Rents
- Leading Indicators Versus Lagging Indicators
- Why Average Rent Alone Is Not Enough
- How Investors Use Rental Analytics
- A Simple Investor Framework
- How Renters Use Rental Analytics
- What the Latest Market Signals Are Telling Us
- Common Misconceptions That Distort Rental Decisions
- Misconception 1: Low Vacancy Always Means a Great Investment
- Misconception 2: Average Rent Tells the Whole Story
- Misconception 3: Rising Rents Always Mean Strong Fundamentals
- Misconception 4: Rental Analytics Is Only for Investors
- Where Beginners Can Find Useful Rental Data
- How to Read a Rental Market More Intelligently
- The Bigger Shift: From Rent Tracking to Market Intelligence
- Final Thoughts
For beginners, rental analytics matters because it answers two different questions that are often confused. The first is, is this a good investment? The second is, is this a good place to live? Those questions overlap, but they are not the same. An investor may focus on income, expenses, and vacancy risk, while a renter may care more about affordability, lease flexibility, transit access, and whether local conditions suggest room to negotiate.
That distinction is especially important in a data-driven rental market. A property can appear attractive because the advertised rent looks high, but if vacancy is rising or turnover is elevated in that area, the long-term picture may be weaker than it seems. On the renter side, a neighborhood can feel out of reach based on city-wide averages, yet the local segment may be softening because new supply is coming online or concessions are starting to appear.
In Canada, the most authoritative public benchmark for rental analytics is the CMHC Rental Market Survey and the CMHC Rental Market Report. These sources track vacancy rates, average rents, rent growth, turnover, and affordability across national, provincial, and major-centre markets. According to CMHC’s Fall 2024 reporting, Canada’s purpose-built rental supply grew by 4.1%, the largest increase in more than 30 years, while the national vacancy rate rose from 1.5% in 2023 to 2.2% in 2024. At the same time, average 2-bedroom rent growth slowed to 5.4% year over year, which is a useful reminder that a market can remain expensive even when growth starts to cool.
This article breaks rental analytics into plain language. We will look at the metrics that matter most, the difference between leading and lagging signals, the common mistakes people make when reading rental data, and how both investors and renters can use the same information in different ways. The goal is not to turn you into a statistician. It is to help you make housing decisions with more confidence and less noise.
Good rental analytics does not just tell you what rent is today. It helps you understand why the market looks the way it does and what may happen next.
What Rental Analytics Actually Means
At its core, rental analytics is the process of interpreting housing-market data to evaluate rental performance and risk. That can include broad market indicators such as vacancy rates and rent growth, or very specific property-level variables such as expenses, unit mix, and expected net operating income. The best analysis usually combines both layers, because market trends shape what a single building can realistically achieve.
Think of rental analytics as the intelligence layer behind a rental decision. Instead of asking only, “What is the rent?” you start asking better questions. How easy is it to find tenants in this neighborhood? Are rents still rising or beginning to level off? Is this building competing with a wave of new supply? Are lower-priced units tighter than premium units, or is the opposite true? Those questions reveal much more than an average listing price ever could.
For investors, rental analytics supports underwriting and portfolio decisions. It helps estimate income stability, assess downside risk, and compare one location with another on more than intuition alone. For renters, it supports timing and negotiating strategy. Data can show whether you are entering a tight market with limited options or a looser one where listings stay available longer and landlords may be more flexible.
One of the most useful beginner concepts is that there is no single “rental market.” There are many submarkets inside the broader picture. A city can show modest vacancy overall while one neighborhood is loosening because of new development and another remains highly competitive because of transit access, schools, or unit scarcity. Even within one neighborhood, studio, one-bedroom, and two-bedroom units can behave differently, and lower-rent units can have very different vacancy patterns than higher-rent units.
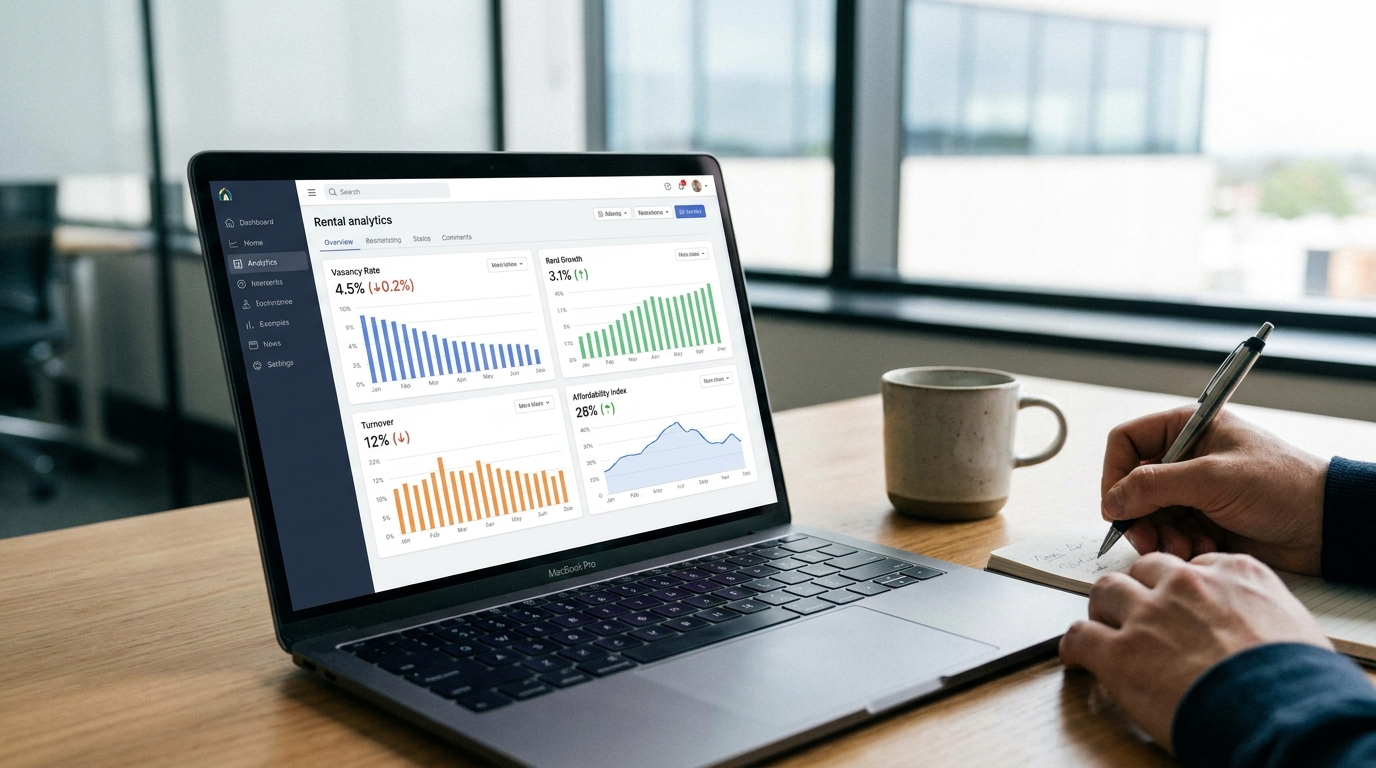
The Core Metrics Every Beginner Should Understand
Rental analytics can become complex, but most decisions begin with a manageable set of metrics. These numbers help describe demand, pricing, stability, and affordability. If you understand what each one is measuring, you can read market reports much more clearly.
Vacancy Rate
The vacancy rate is one of the most widely cited rental indicators. It measures the share of rental units that are unoccupied and available for rent at a given point in time. In general, a lower vacancy rate suggests tighter market conditions and stronger competition for available units, while a higher vacancy rate suggests more supply relative to demand.
However, vacancy should never be read in isolation. A low vacancy rate can indicate strong demand, but it can also coincide with severe affordability pressure and pricing that may be difficult to sustain. A rising vacancy rate can signal softening conditions, but it does not automatically mean rents will fall immediately. As CMHC’s 2024 data showed, Canada’s vacancy rate increased even while rent levels remained high.
Availability Rate
The availability rate is related to vacancy but not identical. It includes units that are vacant and available, as well as some units that may become available shortly. This can offer a broader view of actual renter choice in the market. For a renter, availability can sometimes be a more practical signal than vacancy because it reflects the range of options likely to exist when searching.
For investors, availability can show whether supply pressure is building before it fully appears in vacancy statistics. In markets with many newly completed buildings, availability may rise as landlords begin marketing units ahead of lease-up. That early shift can affect rent growth and concessions before headline vacancy appears dramatic.
Turnover Rate
The turnover rate measures how often tenants move out and units change occupants. High turnover can indicate fluid demand, but it can also suggest instability, tenant dissatisfaction, or weaker retention. Low turnover often points to strong tenant stickiness, limited alternatives, or rent-controlled conditions that encourage staying put.
Turnover matters more than many beginners realize. For investors, it influences leasing costs, downtime, cleaning, repairs, and marketing expense. For renters, it can signal whether a building and its pricing are stable. A market with unusually high turnover may deserve closer inspection, especially if rents are still being marketed aggressively despite signs that tenants are cycling out more often.
Average Rent and Rent Change
Average rent tells you the typical asking or achieved rent level in a market segment, while rent change shows how those prices have moved over time. These are useful metrics, but they are also lagging indicators. They describe where the market has already been, not necessarily where it is going next.
This is one reason many people misread rental markets. Rising rents can reflect strong fundamentals, but they can also reflect the aftermath of past shortages. Likewise, slowing rent growth does not mean rents have become affordable. CMHC’s 2024 finding that 2-bedroom rent growth slowed to 5.4% year over year is a perfect example. Growth moderated, but affordability pressure remained significant because the starting rent level was already elevated.
Rent-to-Income Ratio
The rent-to-income ratio is one of the clearest affordability measures. It compares monthly rent to a household’s monthly income and helps show how financially comfortable or stretched a tenancy may be. This metric matters for renters directly, but it also matters for investors because affordability constraints shape future demand and pricing power.
If a market’s rents are rising faster than local incomes, that can become a ceiling on future growth. A building may look attractive based on recent rent trends, but if tenants are already overextended, further increases may be difficult to sustain. In other words, affordability is not just a social concern. It is also a market signal.
Net Operating Income and Cash Flow
For investors, net operating income, or NOI, is foundational. NOI is the income a property generates after operating expenses such as maintenance, taxes, insurance, and management are deducted, but before financing costs. It helps reveal the earning power of the property itself rather than the financing structure wrapped around it.
Cash flow goes one step further by accounting for debt payments and other real-world ownership costs. A property can have solid rent levels and still produce weak cash flow if expenses are high or financing assumptions are too optimistic. This is why rental analytics should include both market data and realistic property-level modeling.
Cap Rate and Comparable Rents
The cap rate is a quick way to relate NOI to a property’s value or purchase price. It can be useful for comparing opportunities, though it is not a complete decision tool on its own. Two properties with similar cap rates may have very different risk profiles depending on location, building quality, rent segment, and exposure to future supply.
Comparable rents, often called rent comps, are equally important. These are similar units in the same area that help benchmark what a property can realistically achieve. Good comps are not just nearby. They are genuinely comparable in size, age, condition, amenities, and tenant profile. Beginners often overestimate achievable rent by using the highest listing in an area rather than the most relevant benchmark.
Leading Indicators Versus Lagging Indicators
One of the best ways to understand rental analytics is to separate leading indicators from lagging indicators. This distinction helps you avoid relying on yesterday’s numbers to make tomorrow’s decisions. It is also where beginners often gain the biggest improvement in judgment.
Leading indicators tend to signal where the market may be headed. In rental analytics, vacancy rate, availability rate, turnover rate, absorption, and new supply pipelines often fall into this category. If new buildings are opening, listings are sitting longer, and incentives are appearing, the market may be loosening even before average rents visibly decline.
Lagging indicators describe where the market has already moved. Average rent and year-over-year rent change are classic examples. They are valuable, but by the time they appear in reports, conditions may already be shifting underneath them. A market can still post strong rent growth data while new supply is quietly reducing landlord pricing power.
This distinction explains a pattern that has become increasingly important in both Canada and the United States. Recent supply growth has eased pressure in some markets, yet rent levels remain high because previous increases were substantial. In Canada, CMHC’s 2024 data showed improved vacancy without a dramatic drop in rent levels. In the U.S., official vacancy data from the Census Bureau and market commentary on new construction and absorption have shown that supply can move the market toward balance before renters feel immediate price relief.
For beginners, the practical lesson is simple. If you only look at rent levels, you risk reacting too late. If you also track supply, vacancy, turnover, and concessions, you gain a more forward-looking read on the market.
Why Average Rent Alone Is Not Enough
Average rent is useful because it gives a headline reference point, but it is not enough to judge a market. It smooths over major differences between neighborhoods, building ages, unit types, and price segments. That can make the market appear more uniform than it actually is.
CMHC’s rental data tables are especially useful because they go beyond broad averages. They include vacancy by rent quartile, average rents, and local market breakdowns. This matters because lower-priced units often behave differently from higher-priced units. A city may show rising vacancy overall, yet lower-rent units remain extremely tight while luxury units absorb new supply more slowly.
Segmentation is where better decisions happen. A two-bedroom unit near transit in an older purpose-built building may face very different demand conditions than a newer one-bedroom condo rental downtown. Looking only at city-wide average rent can hide that difference. Investors may misprice risk, and renters may assume they have no leverage when certain pockets of the market are actually loosening.
Neighborhood selection also matters more than most beginners expect. Housing demand is hyperlocal. Access to employment nodes, schools, parks, transit, walkability, and services all influence how resilient a rental segment is. A city average may say little about what happens on one corridor or in one specific submarket.

How Investors Use Rental Analytics
For investors, rental analytics is about understanding return potential without losing sight of risk. The starting point is usually income, but smart analysis quickly expands beyond rent. What matters is not just how much a unit can lease for today, but how stable that income is likely to be over the next several years.
A practical first step is to compare expected rent with the full cost structure of ownership. That includes mortgage payments, property taxes, insurance, utilities where applicable, maintenance, management fees, vacancy assumptions, and capital reserves. This creates a clearer estimate of NOI and cash flow. If the deal only works under ideal assumptions, the analytics are already warning you to be careful.
The second step is to test those assumptions against the local market. Are comparable rents truly supportive, or are they based on a handful of ambitious listings? Is vacancy stable, falling, or rising? Are there many units under construction nearby that could increase competition? A property that looks attractive on current rent may underperform if local supply is growing faster than demand.
Investors should also pay attention to turnover and segment-specific vacancy. If the lower-rent segment in a market stays tight while premium stock loosens, that can affect which product type is more resilient. In some cases, modest units in strong locations can produce better long-term stability than upscale units exposed to a large development pipeline.
Another useful approach is scenario analysis. Instead of relying on one forecast, investors can model what happens if rent growth slows, expenses rise, or vacancy increases by one or two points. This does not eliminate uncertainty, but it creates a more durable decision framework. Markets are dynamic, and rental analytics works best when it helps you prepare for a range of outcomes rather than one perfect case.
A Simple Investor Framework
Beginners often benefit from a repeatable structure. Before buying or underwriting a rental property, investors can ask the following questions.
- What is the realistic market rent based on true comparables rather than optimistic listings?
- What is the local vacancy trend, and is it improving or weakening?
- How much new supply is under construction or recently completed nearby?
- What is the turnover pattern in this segment, and what does it suggest about retention?
- After all operating costs and debt service, is the cash flow still acceptable under conservative assumptions?
- How exposed is this property to affordability constraints or segment-specific oversupply?
That framework is simple, but it already puts you ahead of decisions based only on rent headlines and sales marketing.
How Renters Use Rental Analytics
Rental analytics is not just for landlords, asset managers, or real estate professionals. Renters can use the same data to avoid overpaying, identify neighborhoods with better value, and understand when they may have more negotiating power. In many cases, a renter who understands local conditions is in a stronger position than one who only scrolls through listings.
The first advantage is affordability planning. By comparing rent to income, renters can estimate what price range is sustainable before beginning the search. This reduces the risk of stretching for a unit that looks manageable on paper but creates long-term financial pressure. It also helps prioritize whether trade-offs such as location, size, or amenities are worth the cost.
The second advantage is market timing. If vacancy and availability are rising in a neighborhood, renters may find more options, more flexible terms, or occasional incentives. If turnover is increasing and new supply is entering the market, landlords may be more open to negotiating on move-in dates, parking, minor upgrades, or lease length. Those are meaningful benefits even if asking rents have not fallen much yet.
The third advantage is local comparison. A city-wide average can make an area seem unaffordable, but segment-level data may reveal better value in nearby neighborhoods with similar access and livability. Renters who compare submarkets rather than relying on broad headlines often find more strategic options.
Data also helps renters spot warning signs. If a building’s asking rent looks unusually low, it may be because turnover is high, the location is weakening, or the unit competes with a large amount of new inventory. A low number is not always a bargain. Sometimes it is the market pricing in a problem that deserves attention.

What the Latest Market Signals Are Telling Us
Recent rental data highlights why analytics matters more now than in simpler market cycles. In Canada, CMHC reported a major increase in purpose-built rental supply in 2024, with stock growing by 4.1%, the strongest expansion in more than three decades. That supply growth helped raise the national vacancy rate from 1.5% to 2.2%.
At first glance, that sounds like a straightforward easing story. More supply should mean lower pressure. But the data is more nuanced. CMHC also reported that 2-bedroom rent growth slowed to 5.4% year over year in 2024, which means conditions softened somewhat without becoming cheap. This is a critical lesson for beginners. A market can improve in balance while remaining difficult in absolute cost terms.
That same nuance applies elsewhere. In the United States, the Census Bureau remains the main official source for rental vacancy trends, while market analysis has increasingly focused on absorption rates and whether newly completed units are being leased fast enough to keep pace with construction. In several large metros, new supply has eased pressure and, in some places, contributed to rent declines or concessions. Yet even there, local variation remains significant.
The broader trend is that rental analytics is moving beyond simple rent tracking. Supply pipelines, absorption, concessions, turnover, and affordability metrics are becoming central to understanding what is really happening. This is good news for decision-makers because it creates a more complete picture than rent alone ever could.
Common Misconceptions That Distort Rental Decisions
Rental markets generate a lot of confident opinions, and many of them are incomplete. A few misconceptions show up again and again, especially among beginners.
Misconception 1: Low Vacancy Always Means a Great Investment
Low vacancy does suggest strong demand relative to supply, but that does not automatically make a market attractive. If prices are already near a peak and affordability is stretched, future upside may be limited. Low vacancy can also hide operational risk if turnover rises or if incoming supply is about to change conditions.
Misconception 2: Average Rent Tells the Whole Story
Average rent is only a summary statistic. It does not reveal who is competing for which units, whether lower-rent stock is tighter than premium stock, or how one neighborhood differs from another. Segmentation by rent quartile, unit type, and location is often more informative than the city average itself.
Misconception 3: Rising Rents Always Mean Strong Fundamentals
Rents can keep rising because of earlier shortages even when demand is cooling. If supply is growing and new inventory is taking longer to absorb, the market may already be shifting toward balance. This is exactly why leading indicators are so important. They often show the turn before average rent does.
Misconception 4: Rental Analytics Is Only for Investors
This is one of the least helpful myths in housing. Renters benefit from analytics too. Knowing whether concessions are appearing, whether a neighborhood is loosening, or whether rent growth is slowing can directly improve a renter’s choices and negotiating position.
Where Beginners Can Find Useful Rental Data
For Canadian housing analysis, the strongest public benchmark is CMHC. The Rental Market Survey, Rental Market Report, and CMHC’s rental data tables provide national, provincial, and major-centre insight. These resources are especially valuable because they include vacancy rate, average rents, vacancy by rent quartile, and local market segmentation rather than only headline numbers.
For U.S. rental vacancy trends, the U.S. Census Bureau’s Housing Vacancies and Homeownership series remains the official anchor. Market commentary from major housing platforms and research firms can add context, particularly around absorption, concessions, and newly completed supply, but official public data helps ground those narratives in a reliable baseline.
Beginners should also remember that platform data and listing data can differ from survey-based market data. Listings reflect what is being asked, not always what is being achieved. Survey reports may be less immediate, but they are often more methodologically stable. The most informed approach uses both, with an understanding of each source’s strengths and limits.
How to Read a Rental Market More Intelligently
If you are new to rental analytics, do not try to track everything at once. Start by building a clear sequence. First, identify the market and submarket you care about. Second, review vacancy, availability, and turnover to understand current conditions. Third, look at rent levels and rent growth. Fourth, test affordability and compare against income realities. Finally, consider future supply and absorption to assess where the market may be heading.
That sequence matters because it moves from structure to price rather than the other way around. Too many people start with the asking rent and stop there. Better analysis begins with supply and demand, then asks whether current pricing is supported, stretched, or likely to soften.
It also helps to compare multiple time horizons. Month-to-month changes can be noisy, while year-over-year changes may hide a recent inflection point. Looking across both can reveal whether a trend is accelerating, stabilizing, or reversing. Context is often more valuable than any single number.
Finally, keep the human side in view. Data is essential, but rental decisions are not purely mathematical. Building quality, commute patterns, neighborhood fit, school access, and household flexibility all matter. The role of analytics is not to flatten those priorities. It is to give them a smarter foundation.
The Bigger Shift: From Rent Tracking to Market Intelligence
The most important evolution in rental analytics is that it is no longer just about tracking rent. The field is moving toward broader market intelligence. That means understanding supply pipelines, segment-level pressure, affordability constraints, absorption of new buildings, and the relationship between macro conditions and local outcomes.
This shift is healthy for the industry and useful for everyday decision-makers. It reduces reliance on simplistic narratives like “rents are up” or “vacancy is down” and replaces them with a more complete framework. A market can be more balanced and still expensive. A neighborhood can be attractive yet vulnerable to oversupply. A unit can look affordable today but become stressful if it pushes the household’s rent-to-income ratio too far.
For investors, this broader intelligence supports better underwriting and more resilient strategy. For renters, it supports more realistic budgeting and stronger negotiating leverage. In both cases, the value is the same. Better information lowers the chance of making a decision based on incomplete signals.
Final Thoughts
Rental analytics is not about drowning in charts. It is about asking better questions and using data to answer them. For investors, that means looking beyond headline rents to vacancy, affordability, turnover, and operating performance. For renters, it means understanding where choice is improving, where prices are likely to stay elevated, and how local conditions affect bargaining power.
The latest Canadian data from CMHC makes the lesson especially clear. Supply can grow significantly and vacancy can rise, yet rents may remain high because housing markets adjust in layers rather than all at once. That is why relying on one metric is rarely enough. A smart read of the rental market combines current pricing with demand signals, segment detail, and future supply context.
If you are just starting out, begin with the basics and stay consistent. Learn what vacancy, turnover, affordability, and NOI actually mean. Compare neighborhoods instead of trusting city averages. Separate leading indicators from lagging ones. Most importantly, remember that data is not there to make decisions for you. It is there to help you make better ones.
In a housing market that is increasingly shaped by speed, complexity, and local variation, rental analytics offers something rare: clarity. And whether you are investing capital or choosing your next home, clarity is a serious advantage.



No Comment! Be the first one.