



There is something deeply reassuring about understanding what is happening inside your home. We notice when a room feels too warm, when the dryer seems to run forever, or when a monthly utility bill arrives higher than expected and leaves us wondering what changed. For many households, energy use still feels invisible until the bill shows up. That gap between everyday living and monthly cost is exactly where energy tracking dashboards can make a meaningful difference.
Table Of Content
- What Is an Energy Tracking Dashboard?
- Why Energy Dashboards Matter More Than Ever
- How Energy Tracking Dashboards Actually Work
- The Emotional Benefit: From Guesswork to Calm
- What You Can Learn From a Dashboard
- What Energy Dashboards Cannot Do on Their Own
- Who Can Benefit From an Energy Dashboard?
- Choosing the Right Energy Tracking Dashboard for Your Home
- How to Use a Dashboard Without Becoming Obsessed
- Simple Ways to Act on What You Learn
- Energy Dashboards and the Future of Better Living at Home
- Final Thoughts
At their best, these dashboards do much more than display numbers. They help turn vague concerns into patterns you can actually work with. Instead of asking yourself why your energy costs are rising, you can begin to see that heating and cooling are peaking at certain times, that standby devices are quietly drawing power, or that one appliance may be using more than expected. This kind of visibility creates a feeling many people are looking for right now, which is not perfection, but confidence.
Energy tracking dashboards are becoming more relevant across North America as utilities, smart meters, connected devices, and home energy systems become more common. Ontario alone has more than five million smart meters installed, and similar momentum is happening elsewhere as utilities offer customer portals and usage apps. What once felt like a niche tool for tech enthusiasts is now becoming a practical household resource for homeowners and renters who simply want a home that feels easier to manage.
This guide will walk through how energy tracking dashboards work, what they can and cannot do, why they matter emotionally as well as financially, and how to choose a setup that fits your home and lifestyle. The goal is simple: to help you feel more in control of your energy use so your home can support your routines more comfortably and more efficiently.
The biggest value of an energy dashboard is not just data collection. It is clarity. When your energy use becomes visible, your choices become easier.
What Is an Energy Tracking Dashboard?
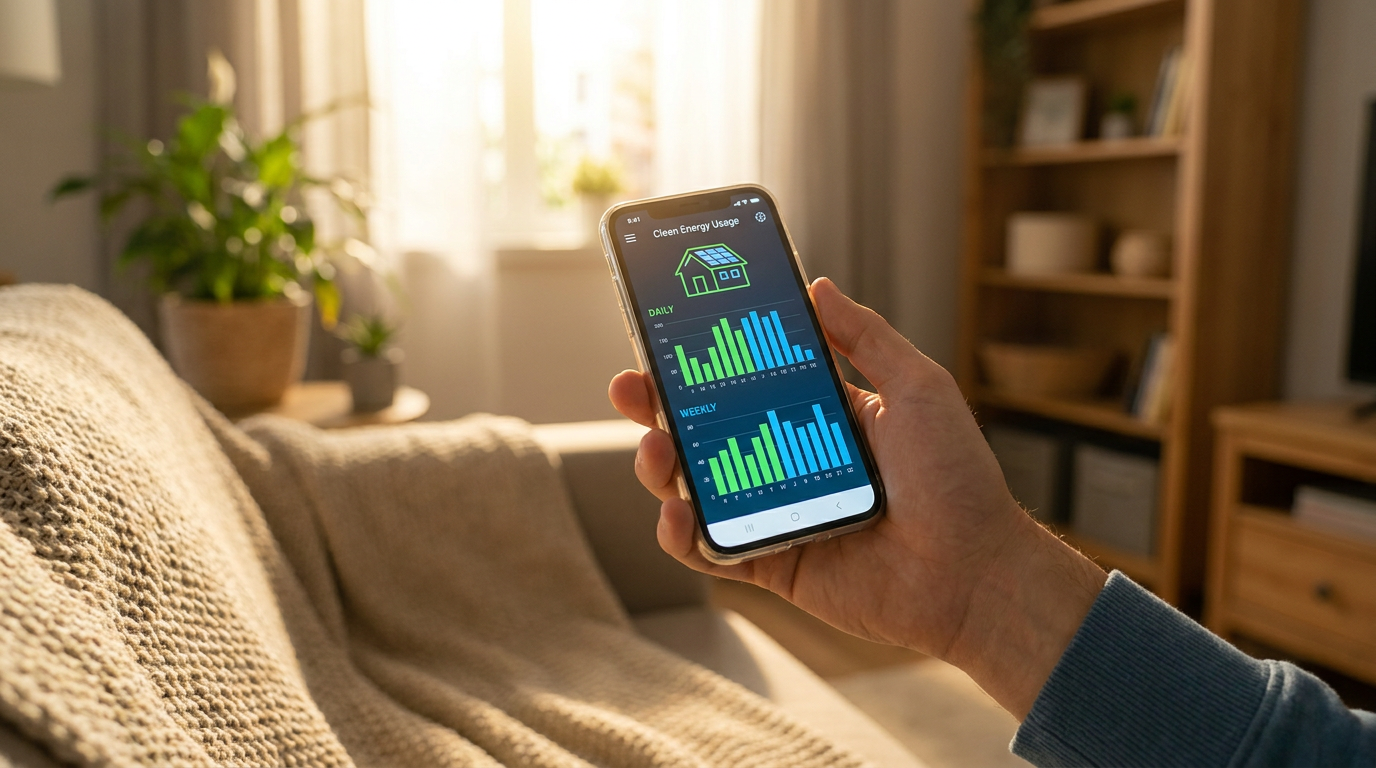
An energy tracking dashboard is a digital tool that shows how much energy your home is using over time. Depending on the product or service, it may display electricity, natural gas, or other home energy data in near real time, by the hour, by day, or by month. Some dashboards live inside a utility app. Others are part of a smart home platform, a whole-home monitoring system, or a set of connected smart plugs and thermostats.
The main purpose is to translate raw consumption data into something easier to understand. Instead of a billing statement filled with totals and dates, you see visual charts, estimated costs, usage trends, alerts, and comparisons. That might mean noticing an evening spike every night around dinner, a sharp rise during a heat wave, or steady overnight use from devices that never fully turn off.
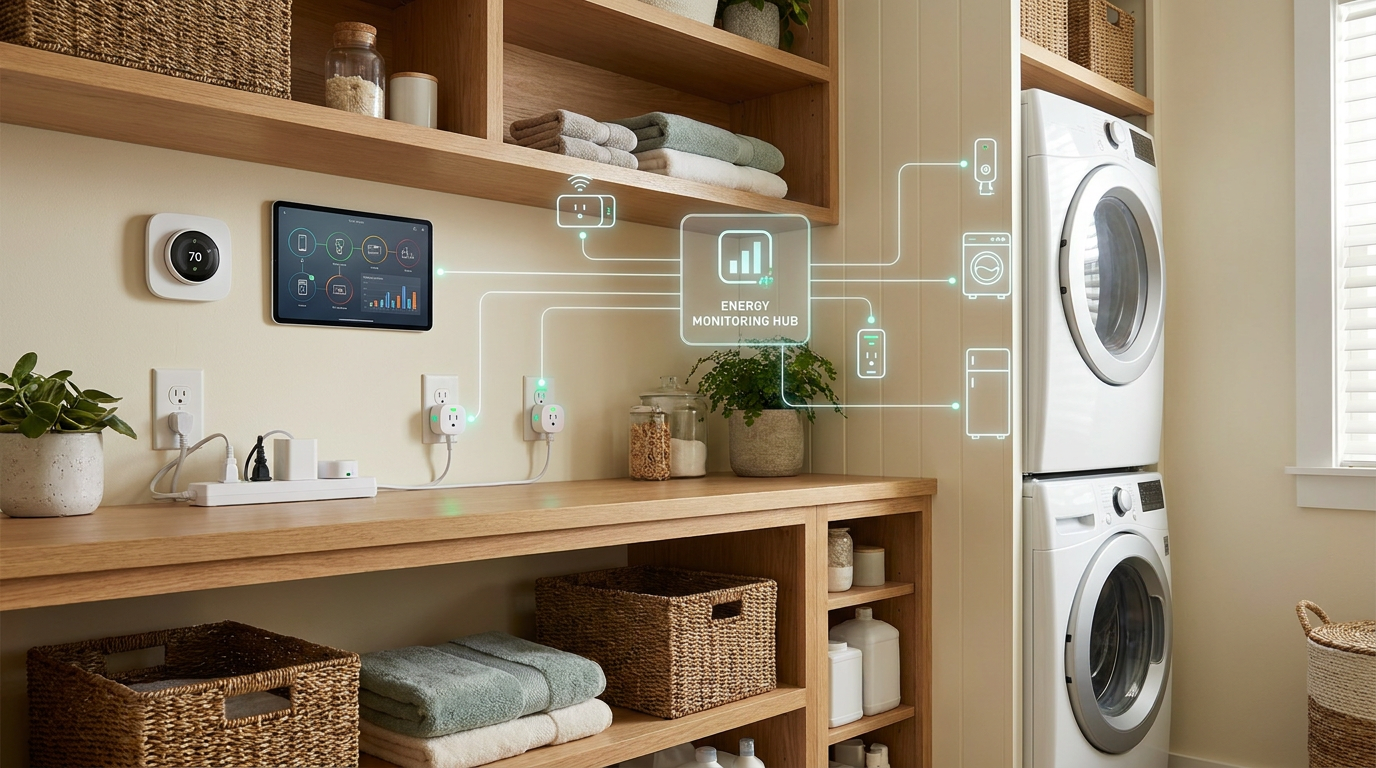
Many dashboards gather information from one of several sources. Some connect to a utility smart meter, which can provide household consumption data with regular updates. Others rely on a whole-home energy monitor installed in the electrical panel or near it. Some focus on individual devices through smart plugs, while more advanced home energy management systems bring several layers together into one central view.
That range is important because not every home needs the same level of detail. For one household, a utility portal that shows daily electricity use may be enough to support better habits. For another, especially one with electric heating, high bills, or a strong interest in automation, a more detailed dashboard tied to thermostats, plugs, and sensors may feel worth the investment.
Why Energy Dashboards Matter More Than Ever
Home energy use affects more than a monthly budget. It shapes comfort, routine, and peace of mind. When bills are unpredictable, it can create low-level stress that sits in the background of everyday life. You may second-guess how often you run the air conditioner, wonder whether an older appliance is draining money, or put off making changes because you are not sure where the real problem is. A dashboard helps remove some of that uncertainty.
Government and utility research increasingly supports the idea that feedback changes behavior. U.S. Department of Energy materials note that smart-meter and home-energy feedback programs typically deliver measurable savings. Behavior-based programs are often cited in the range of about 1% to 3% annual savings, while broader residential feedback studies have found total-home savings in the 5% to 15% range in some cases. The exact outcome depends on how often people engage with the information and whether the system encourages specific action.
That point matters because a dashboard by itself is not magic. It is a mirror, not a makeover. It does not lower your bill simply by existing. What it does do is make it easier to spot waste, test changes, and build better habits over time. If you lower the thermostat overnight, adjust laundry timing, unplug a spare fridge, or automate lights and fans, the dashboard can help you verify whether those changes actually made a difference.
There is also a larger shift happening in how energy data is being used. Utilities and public agencies increasingly frame household energy visibility as part of affordability, planning, and demand management. In simpler terms, energy tracking is no longer just about curiosity. It is about helping households make more informed choices in a world where energy costs, grid pressures, and climate concerns all feel more immediate.
How Energy Tracking Dashboards Actually Work
Most dashboards start with a source of energy data. In many homes, that source is the utility smart meter. Smart meters record electricity consumption in intervals and send that information back to the utility. If your utility offers customer access through an app or online portal, you may already have a basic dashboard available without buying any new hardware.
Another option is a whole-home energy monitor. These systems are typically installed on or near your electrical panel and measure the total electricity flowing into your home. Some can estimate energy use in near real time, giving you a live sense of what happens when major equipment turns on. If the air conditioner starts, the oven preheats, or the dryer begins a cycle, you may see usage climb almost immediately.
Then there are appliance-level monitors, often in the form of smart plugs or connected outlets. These are useful for tracking individual devices such as space heaters, coffee makers, entertainment systems, or dehumidifiers. The U.S. Department of Energy describes both whole-house monitoring systems and appliance-level monitors as practical tools for estimating energy use, costs, and phantom loads, which are devices that keep drawing power even when they appear to be off.
More advanced setups combine multiple data streams into a home energy management system, sometimes called HEMS. According to research associated with ENERGY STAR smart home energy management systems, effective systems often bring together feedback, smart thermostats, smart lighting, smart plugs or outlets, occupancy sensing, and responses to utility demand signals. In other words, the dashboard becomes part of a smarter ecosystem that not only reports on energy use but helps shape it.
Some platforms also use newer analytics, including AI-assisted pattern recognition and a method called load disaggregation. This means the system tries to infer which appliances are using power based on their electrical signatures, even if you are only measuring the whole home. It is a promising development, though it is best understood as an estimate rather than a perfect diagnosis.
The Emotional Benefit: From Guesswork to Calm
One of the most overlooked benefits of an energy dashboard is emotional relief. Many household costs feel fixed until you can see them clearly. When your energy use is hidden, every bill can feel slightly mysterious. You might feel responsible without feeling informed, which is an uncomfortable combination. A dashboard changes that emotional dynamic by showing patterns you can respond to.
Imagine opening an app and noticing that your energy use rises sharply every weekday from 5 p.m. to 9 p.m. That pattern may reflect cooking, laundry, dishwashing, lighting, and cooling all happening at once. It does not mean you are doing anything wrong. It simply gives you a clearer picture of when your home is working hardest. From there, small adjustments become much easier to consider.
This is where the lifestyle value comes in. A well-used dashboard can help you shape a home that feels better to live in, not just cheaper to run. You may decide to pre-cool the home earlier in the day, shift one appliance cycle to later in the evening, or replace a drafty room heater with a more efficient option. Those choices are practical, but they also reduce friction in daily life.
Clarity can be especially powerful for families, renters on a budget, or anyone trying to create a calmer home environment. There is comfort in seeing your efforts reflected back to you. If you make a small change and your dashboard shows a dip in usage over the next week, that sense of progress can build momentum in a way a single monthly bill rarely does.
What You Can Learn From a Dashboard
The average U.S. household uses about 1,000 kilowatt-hours of electricity per month, according to the U.S. Department of Energy. That number alone does not tell you whether your own home is performing well, since climate, home size, appliances, and occupancy all vary. What a dashboard can do is help you understand your personal baseline, which is often much more useful than comparing yourself with a national average.
Once you have that baseline, several insights tend to stand out quite quickly. One of the most common is identifying major energy drivers. In many homes, heating and cooling dominate electricity or fuel costs. If your dashboard shows a pattern that rises dramatically during very hot or very cold periods, it may confirm that HVAC performance is the heart of your energy picture.
Another valuable insight is the role of timing. If your utility uses time-of-use rates, when you use energy can matter almost as much as how much you use. A dashboard can show whether your highest consumption happens during more expensive periods, giving you opportunities to shift flexible activities such as laundry, dishwashing, or electric vehicle charging.
Dashboards can also reveal background usage that never seems to go away. This is often where standby power enters the story. Entertainment systems, chargers, networking gear, secondary fridges, gaming consoles, and always-on appliances can quietly add up. You may not eliminate every phantom load, but simply seeing that overnight baseline can help you decide what is worth changing.
For households considering larger upgrades, dashboards can support smarter decision-making. If your data suggests that an older air conditioner is running hard and often, that may strengthen the case for replacement. If your usage barely changes despite careful thermostat habits, the issue may be insulation, air sealing, or equipment efficiency rather than behavior alone. In this way, dashboards complement bigger home improvements instead of replacing them.
What Energy Dashboards Cannot Do on Their Own
As helpful as these tools are, it is important to approach them with realistic expectations. A dashboard does not automatically save money by itself. It only becomes valuable when the information leads to action, whether that action is behavioral, such as changing routines, or technical, such as upgrading equipment or adding automation.
It is also easy to assume that more data must always be better. In reality, too much information can be surprisingly unhelpful if the dashboard is cluttered or difficult to interpret. A homeowner who only wants basic insight may feel overwhelmed by minute-by-minute graphs and appliance guesses. A clear dashboard that highlights meaningful trends is often more useful than a complicated platform full of numbers but short on guidance.
Another limitation is that consumption data does not always explain the cause of a problem on its own. If your use suddenly rises, the dashboard may show the timing and magnitude, but not necessarily the full reason. Weather changes, more people at home, holiday cooking, a malfunctioning appliance, or a shift in utility rates can all influence what you see. Good interpretation still requires context.
Savings also vary widely from one household to another. Some homes have easy opportunities because usage is high or equipment is outdated. Others may already be relatively efficient, which means the dashboard still offers reassurance and visibility, but the savings may be smaller. This does not make the tool any less worthwhile. It simply means the benefits can be financial, practical, and emotional in different proportions.
Who Can Benefit From an Energy Dashboard?
One common misconception is that energy tracking is only for homeowners with solar panels, electric vehicles, or highly automated smart homes. In reality, a wide range of households can benefit. Renters can use utility apps, smart plugs, and portable monitors to understand what appliances and habits matter most. Homeowners with older houses can use dashboards to spot patterns before investing in bigger upgrades. Families can use them to manage routines around comfort and cost.
These tools can be especially useful during life transitions. A new baby, a move to remote work, a renovated kitchen, a newly finished basement, or aging parents moving in can all change how a home uses energy. A dashboard provides a way to see those changes clearly instead of guessing your way through them.
Budget-conscious households often find dashboards valuable because they support planning. If your energy costs fluctuate by season, having a daily or weekly picture can make those increases feel less sudden. You may notice that a summer cooling pattern is intensifying earlier than expected, or that winter heating costs rise sharply after a cold snap. That awareness helps you make decisions sooner.
Even households that are not focused primarily on savings can benefit through comfort and convenience. If a dashboard helps you notice that one room heater is drawing a lot of power but still leaving the room chilly, that can guide a better solution. If it helps you automate lights or identify waste from forgotten devices, the result is a home that feels smoother to live in.
Choosing the Right Energy Tracking Dashboard for Your Home
The best dashboard is not necessarily the most advanced one. It is the one that gives you the right amount of visibility for your goals. Before comparing products, it helps to ask what you most want from the experience. Are you trying to lower bills, understand HVAC use, monitor a second property, reduce standby power, or simply feel less confused by your monthly statement?
If your needs are basic, start with what may already be available. Many utilities now offer apps or web portals that show smart-meter data by day or billing period. These tools can be a low-effort way to establish patterns before you spend money on hardware. If you find yourself wanting more detail later, you can always build from there.
If you want greater insight into live energy use or household totals, a whole-home monitor may be the next step. These systems are helpful for people who enjoy seeing immediate feedback and connecting changes to actual consumption. They can be especially useful in all-electric homes or households with high summer or winter bills.
For people focused on specific devices, smart plugs are often one of the easiest and most approachable entry points. They let you track lamps, fans, coffee machines, media centers, or portable heaters individually. They are also helpful for renters because they usually do not require permanent installation.
If you are creating a broader smart home ecosystem, look for compatibility. NREL research on smart home energy management systems highlights the value of combining dashboard feedback with smart thermostats, lights, outlets, occupancy sensing, and utility responsiveness. When these tools work together well, the dashboard becomes less of a passive report and more of an active comfort manager.
As you compare options, consider the following questions:
- Does it track the whole home, individual devices, or both?
- Does it show near-real-time use, daily summaries, or monthly trends?
- Can it estimate costs based on your utility rate plan?
- Does it send alerts for unusual spikes or ongoing standby loads?
- Is the interface clear enough that you will actually use it?
- Can it integrate with thermostats, plugs, lighting, or occupancy sensors?
- Does it require professional installation or work as a simple plug-in solution?
These questions matter because convenience often determines success. The most sophisticated dashboard in the world will not help much if it feels frustrating to open. A simpler system that fits naturally into your routine may lead to better results over time.
How to Use a Dashboard Without Becoming Obsessed
One gentle caution is worth mentioning. Because dashboards can be updated frequently, it is possible to check them too often and turn useful awareness into unnecessary stress. The goal is not to monitor every watt all day long. The goal is to notice patterns, make thoughtful changes, and let your home work better in the background.
A balanced approach often works best. Spend the first week or two simply observing. Notice when your highest and lowest use tends to happen. Pay attention to what changes on hot days, cold days, weekdays, and weekends. Then choose one or two adjustments to test rather than trying to optimize everything at once.
For example, you might set a smart thermostat schedule, unplug a secondary appliance, or move laundry to a lower-cost period. Check the dashboard after several days to see whether the change holds. This rhythm of observe, adjust, and review keeps the process practical and calm.
It can also be helpful to think seasonally. Energy use shifts throughout the year, so a dashboard is best understood as a long-term companion rather than a quick fix. What you learn in winter about heating patterns may look very different from what you learn in summer about cooling and ventilation.
Simple Ways to Act on What You Learn
Once you begin seeing your usage more clearly, the next step is making it actionable. The best changes are often small and realistic. They fit your actual life, rather than asking you to run your home in a way that feels inconvenient or joyless. A dashboard should support your routine, not dominate it.
Start with the biggest visible patterns. If cooling is clearly your top energy driver, focus there first. That might mean cleaning filters, adjusting thermostat settings, using blinds strategically, or improving airflow with ceiling fans. If evening demand is especially high, look for flexible tasks you can spread out rather than stacking everything into the same hour.
Standby power is another easy place to look. If your overnight baseline seems higher than expected, try using smart plugs or power strips for entertainment zones, home office equipment, or guest-room electronics that sit idle much of the time. The savings from any one item may be modest, but the cumulative effect can still be worthwhile.
For homes considering larger improvements, dashboards can help you prioritize. Weatherization, insulation, efficient appliances, and home energy assessments remain essential tools. The U.S. Department of Energy emphasizes that reducing electricity use lowers bills and pollution, and can reduce the size and cost of a future renewable-energy system. Dashboards fit into that bigger picture by showing where attention may matter most first.
- Establish your baseline for two to four weeks without changing much.
- Identify one major pattern, such as HVAC spikes, high evening use, or overnight standby load.
- Choose one practical change to test for at least several days.
- Review the dashboard for changes in use and estimated cost.
- Keep what works, then move to the next improvement.
This gentle, iterative method tends to be more sustainable than trying to overhaul everything at once. It also feels more encouraging because each small success gives you evidence that your efforts matter.
Energy Dashboards and the Future of Better Living at Home
Energy dashboards are increasingly becoming part of a bigger story about how homes function. They are no longer just accessories for tracking bills. They are being woven into broader conversations about electrification, affordability, grid responsiveness, and smarter living. More utilities are exposing smart-meter data through customer-facing apps, and more devices are being designed to connect directly with local utility services where available.
Natural Resources Canada notes that smart devices can increasingly connect with local utilities, supporting both energy savings and grid efficiency. That means dashboards may become more useful over time, not less. As systems improve, households may gain better insight into rate plans, demand-response opportunities, and coordinated device control that works quietly in the background.
AI-assisted analytics are also changing the user experience. Instead of asking households to interpret every graph themselves, future dashboards may get better at highlighting what matters most. They might flag a likely appliance issue, recommend scheduling adjustments based on your utility rate, or suggest seasonal changes before bills climb. The most appealing vision is not a more complicated home. It is a more supportive one.
Still, the heart of this technology remains wonderfully simple. It helps you see your home more clearly. It lets you connect comfort with cost, routine with impact, and intention with results. In a time when so many aspects of household life can feel expensive or unpredictable, that kind of visibility is powerful.
Final Thoughts
An energy tracking dashboard is not about turning your home into a laboratory. It is about making daily life a little easier to understand. When energy use stops being invisible, you gain a practical kind of calm. You can spot waste sooner, make changes with more confidence, and shape a home that feels both comfortable and better managed.
For some households, the immediate value will be savings. For others, it will be reassurance, better routines, or clearer planning around seasonal bills. Many people will experience a mix of all three. What matters most is that these tools help replace guesswork with knowledge, and knowledge with action.
If you are curious, start simple. Check what your utility already offers. Try a plug-level monitor for a few devices. Consider a whole-home system if your bills feel persistently confusing. The right dashboard does not need to be perfect. It only needs to give you enough clarity to make your next decision feel easier.
And that, in many homes, is exactly what better technology should do. It should not just add information. It should support a better way of living.



No Comment! Be the first one.