



Energy consumption data sounds technical at first, but in a smart home it is really about something simple: understanding how your house behaves. For most homeowners, the goal is not to stare at charts all day or become an energy analyst. The goal is to make everyday life easier, more comfortable, and less expensive. When energy data is used well, it becomes a household decision tool that helps you know when to adjust heating, which devices are driving costs, and where upgrades will actually pay off.
Table Of Content
- Why energy consumption data matters in daily life
- What counts as energy consumption data in a smart home
- The biggest opportunity in most homes: heating and HVAC optimization
- How to read thermostat data in a useful way
- Smart meters, smart monitors, and why the difference matters
- How to interpret your home energy data without overcomplicating it
- A simple framework for reading household energy patterns
- Time-of-use pricing, load shifting, and why timing now matters more
- Examples of practical load shifting
- What smart home energy monitoring can reveal about appliances
- Why benchmarking matters before you judge your bill
- Privacy, trust, and who sees your household energy patterns
- How electrification makes home energy data more important
- Common misconceptions that lead homeowners astray
- A practical action plan for homeowners
- Smart home energy checklist
- The real value of energy data: a home that is easier to run
That practical lens matters because many people assume energy savings come from small sacrifices, like turning off an extra lamp or unplugging a toaster. Those habits can help at the margins, but household energy use is usually driven by much larger systems. In Canada especially, residential energy use is heavily shaped by space heating and water heating. That means the biggest gains typically come from better thermostat control, more efficient equipment, improved insulation, smarter scheduling, and a clearer understanding of how the home uses energy across the day.
Smart homes make this easier because they generate useful information automatically. A smart meter can show time-stamped household consumption. A connected thermostat can reveal heating patterns, temperature schedules, and run times. A home energy monitor can uncover spikes tied to specific circuits or appliances. Instead of guessing, homeowners can compare before and after results, identify waste, and decide whether a new habit or equipment upgrade is worth the effort.
The key point is that energy data only becomes valuable when it leads to action. More information does not automatically produce lower bills. Data needs context, and context means understanding your home size, family routines, climate, electricity rate structure, and heating system. Once those pieces line up, energy consumption data becomes one of the most useful intelligence layers in the modern home.
Smart home energy data is not just about watching numbers. It is about making smarter, simpler household choices that align comfort, cost, and real usage patterns.
Why energy consumption data matters in daily life
For homeowners, the best use of energy consumption data is visibility. Most utility bills arrive after the energy has already been used, which makes them a backward-looking summary rather than a management tool. They tell you what happened, but not always why it happened. Smart home data changes that by showing patterns while they are still useful. Instead of waiting until the end of the month, you can see whether your heating system has been running unusually often, whether a cold snap changed your demand, or whether peak-hour habits are increasing your bill.
This visibility supports better daily decisions. If you know that electricity is more expensive during specific hours under a time-of-use tariff, you can shift laundry, dishwashing, or EV charging to cheaper periods. If you notice that the home gets overheated in the afternoon, you can adjust thermostat settings or blinds rather than cooling the space aggressively later. If your water heater shows recurring high consumption overnight, that may point to settings, insulation issues, or equipment inefficiency. Data turns vague impressions into specific opportunities.
It also improves comfort. That may sound counterintuitive because energy advice is often framed around cutting back. In reality, many smart home improvements reduce waste without reducing comfort at all. Better temperature scheduling, occupancy-based automation, and load management let the home respond more intelligently to how people actually live. The result is not a colder or darker home. It is a home that performs better with less waste.
There is also a resilience angle. As homes add heat pumps, EV chargers, battery systems, and more connected appliances, the household energy profile becomes more complex. Knowing how and when energy is consumed helps homeowners avoid overloads, manage costs during peak events, and prepare for utility programs that reward demand flexibility. Energy consumption data is increasingly part of ordinary home management, much like budgeting or maintenance tracking.
What counts as energy consumption data in a smart home
Not all energy data is the same, and that distinction matters because each source answers a different question. A utility smart meter typically records whole-home energy consumption for billing and grid management purposes. Measurement Canada notes that smart-meter functions may include automatic meter reading, outage identification, and time-stamping of usage for rate allocation such as time-of-use billing. This makes smart-meter data especially useful for understanding your overall load profile and how it lines up with your tariff.
Home energy monitoring devices offer a different level of detail. Some monitor the entire home from the electrical panel and estimate when certain appliances turn on. Others track individual circuits, which can help isolate HVAC equipment, water heaters, dryers, ovens, or EV chargers. Appliance-level devices go deeper still by measuring a specific machine directly. If your question is, “Why was my bill high this month?” whole-home data may be enough. If your question is, “Is my old freezer wasting electricity?” appliance-level data is more relevant.
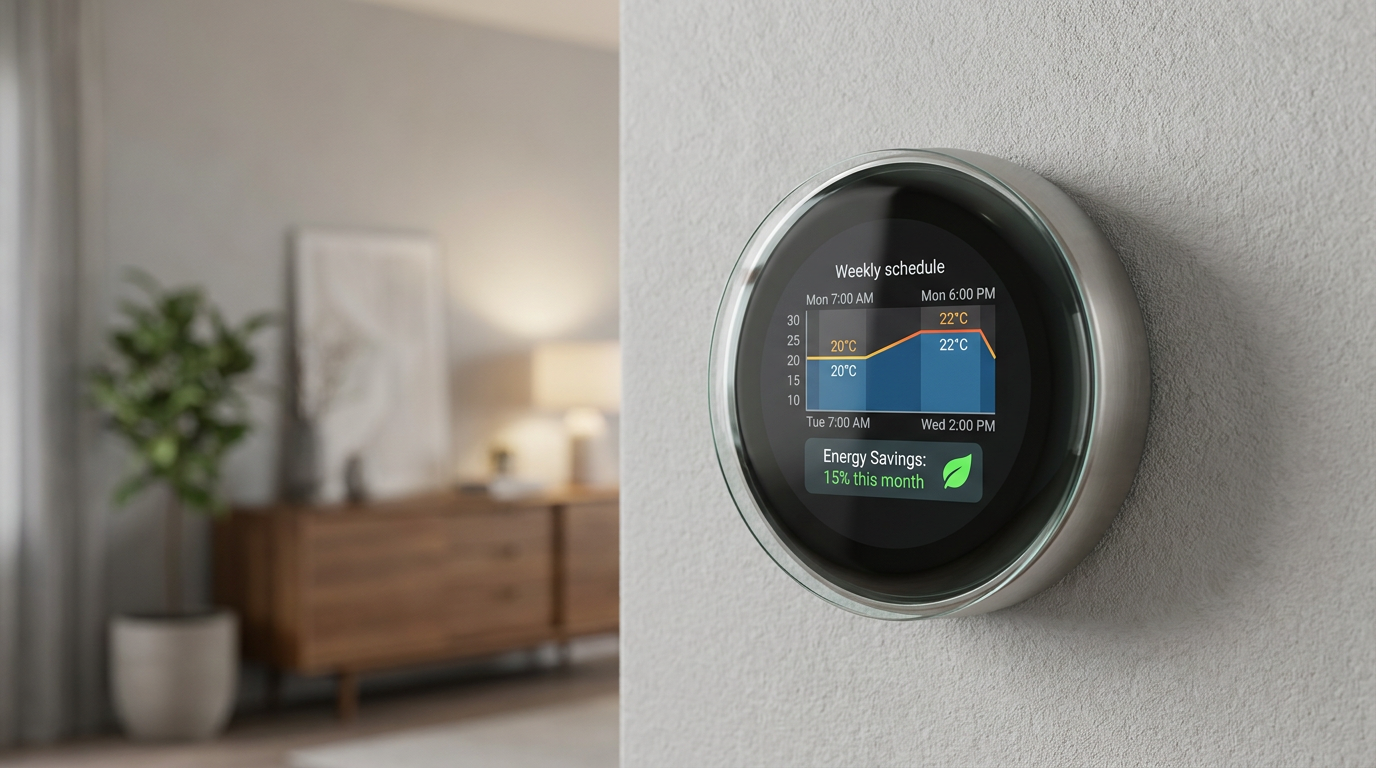
Smart thermostats add another category of data that homeowners often underestimate. They do not just show the current temperature. They reveal run times, setbacks, occupancy patterns, and historical performance. That matters because heating and cooling tend to dominate residential energy use, especially in colder climates. NRCan reporting consistently shows that heating-related loads are a major part of Canadian household energy demand, so thermostat and HVAC data often have more value than people expect.
The most useful way to think about smart home energy data is as a layered system. Whole-home data shows the shape of energy use. Circuit or device data explains specific drivers. Thermostat and HVAC data link usage to comfort. Utility rate data tells you what that pattern costs. When these layers are read together, energy decisions become much more practical.
The biggest opportunity in most homes: heating and HVAC optimization
If homeowners only remember one thing about energy consumption data, it should be this: the largest savings often come from heating and cooling behavior, not from chasing tiny electrical loads. In Canada, that is especially true because climate conditions and heating systems shape a major share of annual consumption. A detailed look at your HVAC pattern usually reveals more savings potential than focusing on phone chargers or countertop appliances.
The U.S. Department of Energy says that a programmable thermostat can save as much as 10 percent a year on heating and cooling by setting back temperatures for eight hours a day by 7°F to 10°F, or about 4°C to 6°C. That figure is important because it illustrates how timing matters. A home does not need to maintain the same temperature every hour to remain comfortable overall. Energy savings come from aligning heating and cooling with occupancy and actual need.
There is also a common misconception that discourages homeowners from trying this. Many people believe that if they lower the thermostat while away, the furnace or heat pump will simply work harder later and erase any savings. DOE directly addresses this idea and notes that the recovery period does not cancel out the benefit. While the home is set back to a lower temperature, it loses heat more slowly. That reduced heat loss is where the savings come from.
Smart thermostats build on this principle by automating it. Rather than relying on a homeowner to manually adjust temperatures every morning and evening, they can use schedules, occupancy signals, and historical patterns to maintain comfort with less waste. The technology alone is not magic. Savings depend on how it is configured, the type of HVAC system, the insulation quality of the home, and whether the residents actually use the scheduling features. Still, for many households, thermostat data is one of the quickest ways to turn energy information into measurable results.
How to read thermostat data in a useful way
Many homeowners open the thermostat app, glance at a usage chart, and close it without knowing what to do next. The data becomes useful when you ask practical questions. Are run times unusually long during certain hours? Does the home continue heating while everyone is away? Is a room overheating because the schedule is too aggressive? Does weekend occupancy look different from weekday patterns? Even simple observations like these can lead to more efficient settings.
Seasonal comparison is also valuable. If your heating run time is significantly higher this winter than last winter under similar weather conditions, it may indicate a filter issue, a maintenance problem, or a building envelope weakness. If run times drop after adding insulation or sealing drafts, that is real proof that the upgrade worked. Smart home data helps homeowners move beyond generic efficiency advice and validate what actually changes performance in their own house.
Heat pump owners can use the same approach, with added attention to backup heating and temperature swings. Data can show whether the system is operating steadily and efficiently or whether settings are causing unnecessary reliance on more expensive backup heat. That is especially relevant as residential electrification grows. The more homes adopt electric heating, the more valuable operational data becomes for cost control and comfort management.
Smart meters, smart monitors, and why the difference matters
One of the biggest misconceptions in this area is that smart meter data and smart home energy data are the same thing. They are related, but they serve different purposes. A utility smart meter is primarily a measurement device that records how much energy the whole home uses over time. It supports billing, outage management, and time-based rate allocation. It is useful for identifying high-use periods and understanding the cost implications of your daily pattern.
A home energy monitor is more like a diagnostic tool. It helps homeowners investigate what is behind the total. If your smart meter shows a major evening spike every weekday, the home monitor can help determine whether that spike comes from cooking, electric heating, water heating, laundry, or EV charging. Without that second layer, it is easy to make the wrong assumption and solve the wrong problem.
This distinction is especially important when considering purchases. Some people expect a utility smart meter to tell them exactly which appliance is wasting energy. It usually cannot. Others buy a smart monitor expecting immediate savings, then feel disappointed when the device simply shows data. The truth is that each technology provides a different kind of insight. Savings come when the homeowner matches the right data source to the right decision.
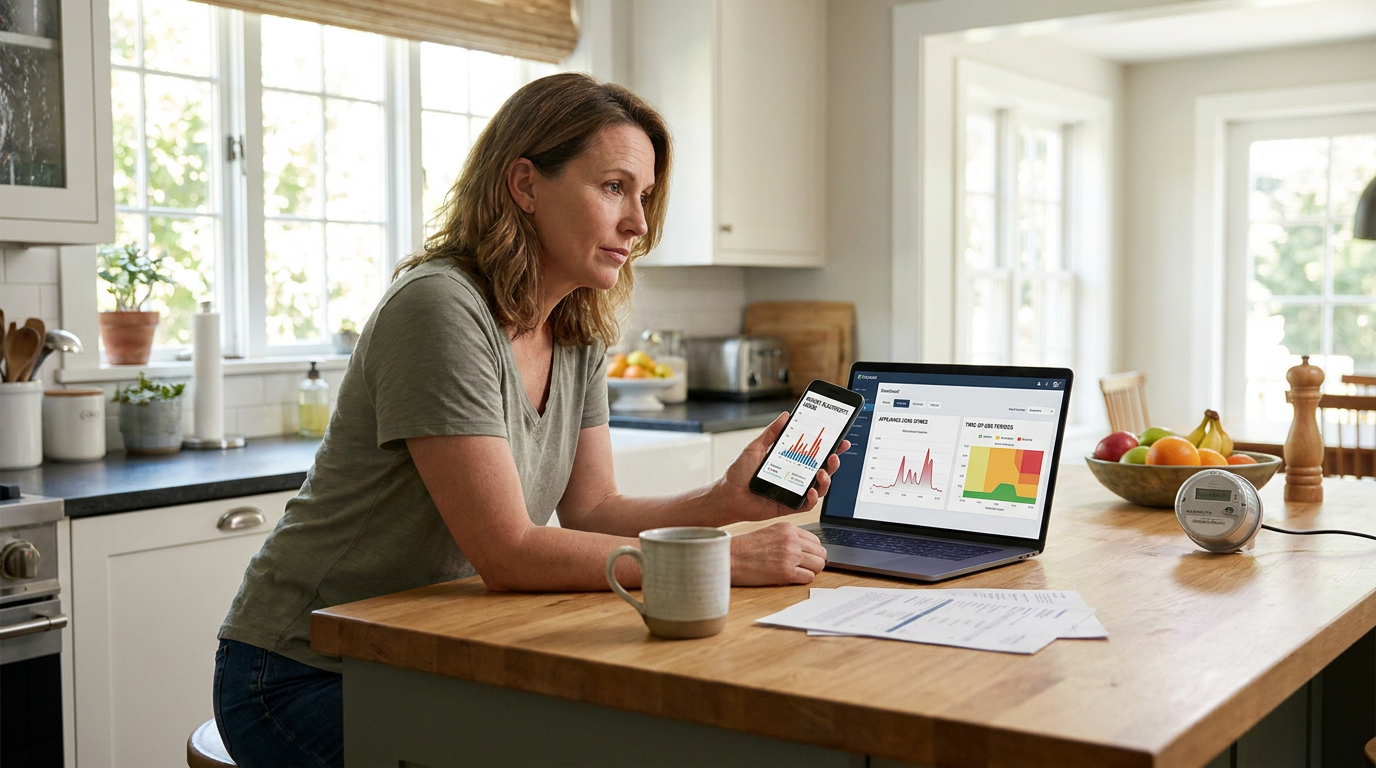
The most practical approach is to start with the data you already have. If your utility portal provides hourly or daily consumption, study that first. Look for peaks, routines, and seasonal shifts. If the pattern raises useful questions that billing data cannot answer, then a panel-based monitor or appliance tracker may be worth adding. That stepwise approach is usually more cost-effective than buying multiple devices at once.
How to interpret your home energy data without overcomplicating it
The easiest way to read energy consumption data is to focus on four dimensions: when energy is used, how much is used, what likely caused it, and what it costs at that time. Most homeowners do not need advanced analytics to make progress. They need a repeatable habit for looking at patterns. Once you build that habit, the data starts to feel less abstract and more like a story about the home.
Start with timing. Does usage spike in the morning when everyone showers, cooks, and gets ready? Does it climb again in the evening when heating, lights, cooking, and entertainment overlap? Is there a noticeable increase overnight from baseboard heating, a water heater, or an EV charger? Knowing when loads occur helps you separate normal household behavior from avoidable waste.
Then consider scale. A small repeated load might be harmless, but a high and persistent load deserves attention. If your baseline usage remains elevated even when the home is mostly inactive, that may point to standby loads, continuous ventilation, a dehumidifier, an aging refrigerator, or another always-on device. If your largest spikes occur during expensive tariff windows, cost reduction may be possible even without reducing total energy use.
Context is what makes the interpretation accurate. Energy data is most actionable when paired with home size, occupancy patterns, heating system type, climate zone, and electricity tariff structure. A detached house in a cold region will not resemble a condo in a milder climate. A family with children and an EV charger will not have the same pattern as a retired couple in a smaller home. Comparisons only matter when they are grounded in similar conditions.
A simple framework for reading household energy patterns
-
Look at your whole-home usage by hour, day, or week and identify the biggest peaks.
-
Match those peaks to household routines such as heating, hot water use, cooking, laundry, or charging.
-
Check whether those peaks happen during high-price time-of-use windows.
-
Choose one change at a time, such as thermostat scheduling or shifting a major appliance cycle.
-
Compare results over two to four weeks rather than reacting to one unusual day.
This method keeps the process practical. The goal is not to eliminate every spike. It is to identify the largest, most controllable drivers and respond where the payoff is meaningful.
Time-of-use pricing, load shifting, and why timing now matters more
As utilities modernize, the question is no longer just how much energy a home uses. It is also when that energy is used. Time-of-use pricing changes the economics of household behavior by making some hours more expensive than others. Measurement Canada points to time-stamping as an important smart-meter function for rate allocation, which helps explain why timing has become central to smart home energy planning.
For homeowners, this creates an opportunity. If your household can shift some loads away from peak periods, you may be able to reduce bills without reducing comfort or total activity. Running the dishwasher later in the evening, scheduling laundry for lower-cost periods, or delaying EV charging until off-peak hours are straightforward examples. These are small operational changes, but across a month they can produce a visible difference.
This is where terms like load shifting and peak shaving become relevant. Load shifting means moving energy use to another time. Peak shaving means reducing consumption during the most expensive or stressed periods. Smart home systems support both by automating schedules and responding to household patterns. Instead of asking people to remember every rate window, the home can do part of the work.
The International Energy Agency identifies smart meters, controllable appliances, and home energy management systems as key enablers of residential demand response and grid flexibility. That may sound like a utility issue rather than a homeowner issue, but the connection is direct. A home that can shift its own demand is often a home that is also more efficient, more cost-aware, and better prepared for future pricing structures.
Examples of practical load shifting
-
Scheduling EV charging after peak evening rates end.
-
Running dishwashers and clothes dryers in lower-cost periods when noise and convenience allow.
-
Pre-heating or pre-cooling the home slightly before expensive hours, then easing HVAC demand during the peak.
-
Using smart water heater controls to avoid unnecessary heating during the highest-cost windows.
These are not extreme changes. They are examples of how data can support a smoother rhythm between household routines and pricing signals.
What smart home energy monitoring can reveal about appliances
Appliances are not always the biggest source of household energy use, but they are often the most visible in monitoring dashboards because they create recognizable spikes. This can be useful because homeowners tend to think in terms of things they can see and control. A monitor that reveals repeated dryer use, a power-hungry old fridge in the garage, or a water heater cycling too often gives people something concrete to evaluate.
That said, appliance data should be interpreted carefully. A high single-use load is not always a problem if it runs rarely. A moderate load that runs constantly may matter more. A refrigerator that cycles normally is not wasteful just because it appears frequently on a chart. The point is not to panic every time a device shows up. The point is to identify unusual, persistent, or expensive behavior.
Appliance-level insights are especially helpful after changes. If you replace an aging freezer, add a heat pump water heater, or install a new washer and dryer, monitoring can show whether the expected savings actually appear. This is where energy data becomes a verification tool. Rather than relying on marketing claims or rough estimates, you can compare patterns in your own home before and after the upgrade.
Monitoring is also useful for behavior. A family may not realize how often the dryer runs during peak pricing periods until the dashboard makes it obvious. They may not notice a second fridge cycling heavily in an unconditioned space. Visibility turns these overlooked habits into manageable decisions.
Why benchmarking matters before you judge your bill
One of the easiest mistakes homeowners make is treating a high bill as automatic proof of inefficiency. Energy costs depend on more than behavior. They reflect climate, occupancy, home size, equipment type, insulation, and rate structures. NRCan data is useful here because it shows how residential energy use varies by home type, region, and heating system. That broader context helps homeowners understand whether their usage is unusually high or simply consistent with their housing conditions.
Benchmarking means comparing your home against an appropriate reference point. The best benchmark is not an average house somewhere else. It is a similar home with a similar occupancy profile, climate exposure, and heating setup. A large detached home in a prairie winter should not be judged against a compact apartment in a temperate area. Without context, energy data can trigger the wrong conclusions.
There is also seasonal benchmarking. Comparing January to July is rarely useful if your home is heating-dominated. A better comparison is January this year versus January last year, adjusted for major changes like occupancy or equipment replacement. This kind of pattern tracking is much more meaningful than reacting emotionally to a single monthly total.
When homeowners benchmark well, they become better at prioritization. They can see whether the bill is being driven mainly by climate and heating demand, or whether there is a fixable issue such as inefficient hot water production, poor scheduling, or unnecessary peak-hour usage. Good interpretation protects people from wasting time on low-impact adjustments while ignoring the real drivers.
Privacy, trust, and who sees your household energy patterns
Energy data can be granular enough to reveal routines, and homeowners are right to care about that. Fine-grained usage patterns can suggest when people are home, when major devices operate, and how daily life is structured. That does not mean smart home tools should be avoided, but it does mean privacy should be part of the decision process from the start.
A useful distinction is between the meter’s measurement role and the sharing rules attached to connected devices. A utility smart meter measures household consumption for operational and billing purposes. A third-party thermostat app or appliance platform may collect additional behavioral data depending on settings and permissions. Homeowners should understand these layers and review what is being shared, stored, and connected across systems.
Trust also depends on interoperability and data quality. Some devices sample frequently and provide near real-time visibility. Others report in broader intervals. Some systems integrate well with tariffs, solar, batteries, or EVs. Others are mostly standalone. Better data is not simply more data. Better data is data that is accurate, understandable, and connected to a useful choice.
Before buying or connecting a device, homeowners should ask practical questions. Who owns the data? Can information be deleted or exported? Does the device work if you switch utilities or platforms? Is there a clear privacy policy? Smart homes are not only about convenience. They are also about confidence that the intelligence layer in the home is serving the resident rather than extracting value invisibly.
How electrification makes home energy data more important
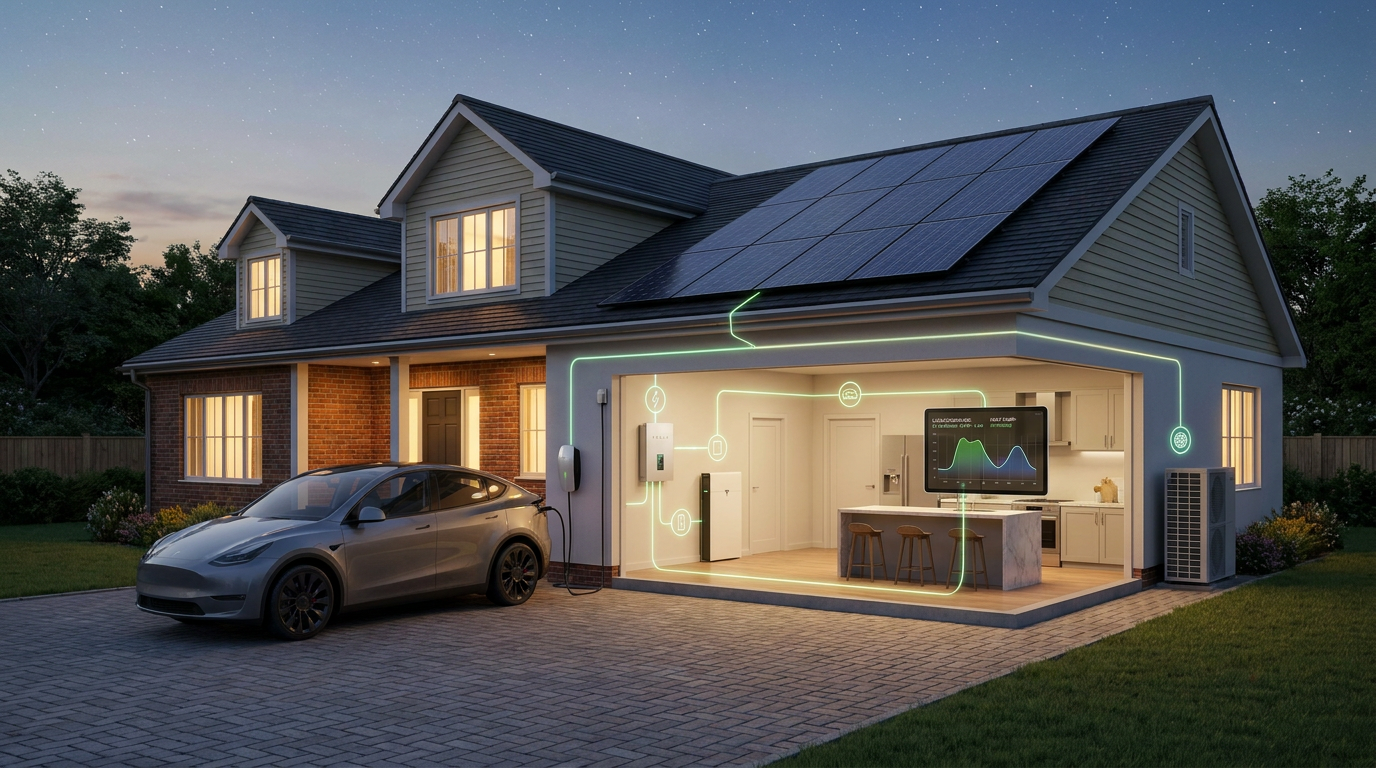
As homes adopt more electric technologies, the value of energy consumption data increases. Heat pumps, electric water heating, induction cooking, and EV charging can improve efficiency and reduce emissions, but they also change how and when a home draws power. A home that once had a simpler electrical profile may suddenly have larger loads, more timing sensitivity, and more opportunities for scheduling.
EV charging is one of the clearest examples. Charging can become a major household load, but it is also highly flexible in many cases because the vehicle often sits parked for long periods. Smart charging allows homeowners to place that demand in lower-cost hours, avoid overlapping with other heavy loads, and sometimes participate in utility programs. Without usage data, it is difficult to know whether charging is increasing bills modestly or creating expensive peak patterns.
Heat pumps also reward better data. Their efficiency depends on settings, climate, home envelope conditions, and system design. Monitoring run time, temperature response, and backup heat behavior helps homeowners understand whether the system is performing as expected. As more households electrify, energy data becomes less of an optional curiosity and more of an operational necessity.
The broader energy system is moving in this direction too. North America is a major market for smart meters, smart home energy devices, and home energy management systems. That growth reflects utility modernization, rising consumer interest in efficiency, and the increasing role of connected homes in demand response and grid flexibility. Homeowners do not need to think like grid operators, but they should recognize that their home is becoming part of a more dynamic energy ecosystem.
Common misconceptions that lead homeowners astray
Smart home energy discussions often get derailed by a few persistent myths. One is that a smart thermostat automatically saves money because it is connected. In reality, savings depend on setup, occupancy patterns, HVAC type, insulation quality, and whether the homeowner uses scheduling and reporting tools effectively. Connectivity helps, but it is not a substitute for strategy.
Another misconception is that reducing energy use always means sacrificing comfort. In practice, many savings come from reducing waste when no one benefits from the consumption. Lowering heating during unoccupied hours, delaying a dishwasher cycle, or identifying an inefficient old appliance does not usually make the home less comfortable. It simply aligns energy use with actual need.
There is also confusion between data visibility and savings. Some homeowners expect a monitoring device to lower the bill on its own. It will not. The device provides intelligence, but the savings come from decisions such as adjusting schedules, replacing inefficient equipment, improving insulation, or shifting loads under a time-based tariff. The same logic applies to smart meters. Their value is real, but it appears when the homeowner responds to the information.
Finally, many people underestimate the dominance of heating-related loads. They spend time optimizing minor electronics while ignoring HVAC, water heating, and building-envelope performance. Data is most useful when it helps you prioritize correctly. In many homes, the path to meaningful savings begins with the largest systems, not the smallest gadgets.
A practical action plan for homeowners
If you want to use energy consumption data effectively, the best approach is incremental. Start by collecting the clearest information available from your utility portal, thermostat, or home monitor. Review one month of patterns and identify the most obvious peaks and routines. Do not try to optimize everything at once. Choose one high-impact area and test a change.
For most households, the first change should involve heating or cooling schedules. Because HVAC is often the biggest load driver, even a modest improvement can matter more than many smaller adjustments combined. If your utility uses time-of-use pricing, the second focus should be on shifting flexible loads such as laundry, dishwashing, or EV charging. If your baseline consumption remains unusually high, consider investigating always-on loads or aging appliances.
After each change, compare the next two to four weeks with a similar earlier period. Look for trends, not perfection. Weather varies, routines shift, and not every day will look the same. What matters is whether the pattern improves under roughly comparable conditions. Over time, this creates a feedback loop in which the home becomes easier to manage because you can see which actions actually work.
Smart home energy checklist
-
Review hourly or daily whole-home usage from your utility account if available.
-
Use thermostat reports to check run times, setbacks, and occupancy alignment.
-
Identify whether your largest loads happen during expensive rate periods.
-
Shift flexible activities such as EV charging, laundry, or dishwashing when practical.
-
Investigate persistently high baseline usage that appears even when the home is quiet.
-
Benchmark your usage against similar homes, not generic averages.
-
Prioritize HVAC, water heating, insulation, and major appliances before minor plug loads.
-
Review privacy settings and data-sharing permissions for connected devices.
The real value of energy data: a home that is easier to run
When people hear the phrase energy consumption data, they often imagine complexity. In practice, the best energy data systems reduce complexity by helping homeowners make fewer guesses. They reveal which systems matter most, which habits drive cost, and which upgrades produce visible results. That is why smart home energy data is becoming mainstream. It fits naturally into the broader shift toward more responsive, efficient, and connected homes.
The value is not only financial, although lower bills are a major benefit. Good energy data also supports better comfort, fewer routine frustrations, and more confidence in household decisions. It helps answer practical questions like whether a thermostat schedule is working, whether an upgrade paid off, or whether a rising bill reflects weather, occupancy, or equipment performance. These are everyday concerns, and data makes them easier to navigate.
For Canadian homeowners in particular, the strongest opportunities usually begin with heating and hot water. NRCan context, smart-meter visibility, thermostat intelligence, and targeted home monitoring can work together to show where the real load drivers are. That matters more than chasing every small watt. A well-run smart home is not one that obsesses over every number. It is one that uses the right numbers to make sensible decisions.
In the end, energy consumption data is most powerful when it stays grounded in ordinary life. It should help a family stay comfortable, manage costs, and prepare for a future with smarter tariffs, more electrification, and more connected devices. The technology is useful, but the real outcome is simpler than that. A home that understands its own energy use is a home that becomes easier, cheaper, and smarter to live in.


No Comment! Be the first one.