



Construction projects generate more information than most teams realize. Every daily log, safety observation, progress photo, equipment ping, inspection record, and weather note creates a small piece of operational truth. On its own, each piece may seem routine. When combined and interpreted properly, that same information becomes site analytics, a practical decision system that helps contractors, owners, and field leaders act earlier and manage projects with greater confidence.
Table Of Content
- What Site Analytics Really Means in Construction
- Why Site Analytics Matters More Than Ever
- The Most Valuable Jobsite Data Sources
- Daily Logs
- Progress Photos and Visual Records
- Equipment Telematics
- Safety Observations and Near Miss Reports
- Inspections, QA Records, and Rework Data
- Scheduling and Coordination Data
- Leading Indicators Versus Lagging Indicators
- How Site Analytics Improves Real Project Outcomes
- Improving Safety Performance
- Protecting Schedule Performance
- Raising Productivity
- Reducing Rework and Quality Drift
- Optimizing Equipment and Logistics
- Building a Practical Site Analytics Workflow
- The Best Tools for Site Analytics
- Common Mistakes That Limit Analytics Value
- Site Analytics for Small and Mid Sized Contractors
- Regional Context Across Canada and North America
- How to Start Using Site Analytics on Your Next Project
- The Future of Construction Intelligence on Site
- Conclusion
That distinction matters. Many firms still treat analytics as reporting that happens after the fact, usually in a weekly meeting or at month end when a delay, cost overrun, or quality issue is already visible. Effective site analytics works differently. It turns live field inputs into signals that show where performance is drifting, where risk is building, and where management action will have the highest return while there is still time to change the outcome.
In modern construction, this is not a luxury. It is a response to a demanding operating environment shaped by tight labor markets, compressed schedules, high safety expectations, and rising pressure to improve productivity without compromising quality. OSHA continues to classify construction as a high hazard industry, with persistent risks such as falls, struck by incidents, electrocutions, and exposure to silica and asbestos. That alone makes a stronger case for better data. But site analytics goes beyond safety. It supports schedule control, logistics planning, rework reduction, equipment optimization, crew coordination, and cost discipline across the entire jobsite.
For teams in Canada and across North America, the opportunity is especially practical. You do not need a futuristic command center to benefit from analytics. Many of the most useful insights already exist in the field. ENR has pointed out that the daily log is an underused source of productivity and efficiency data, which is a useful reminder that the jobsite already contains a rich intelligence layer. The challenge is not collecting random data. The challenge is collecting the right data consistently, standardizing it enough to compare patterns, and connecting the findings to decisions that site leaders can actually act on.
This guide explains how to do that. It focuses on the practical applications of site analytics, the types of data that matter most, the tools that make analysis usable, and the management habits that turn a dashboard into real project improvement. If your goal is better decisions rather than more reports, site analytics is one of the highest value capabilities you can build.
What Site Analytics Really Means in Construction
Site analytics is the structured use of jobsite data to improve project performance. In construction, that means taking information generated during daily operations, such as daily logs, safety observations, progress photos, equipment telematics, and inspection records, and translating it into decisions about safety, productivity, schedule, quality, logistics, labor deployment, and cost control. It functions as the intelligence layer between field activity and project control: field teams observe conditions, digital tools record those observations, and analytics identifies the patterns, exceptions, and emerging risks that matter. The best site analytics programs do not stop at description. They help teams predict issues before they cause delays or incidents, prioritize which risks deserve attention first, and verify whether the resulting interventions actually worked. Used this way, site analytics turns routine field paperwork into a decision system rather than a historical record.
Management then uses those insights to make operational choices such as reallocating crews, adjusting sequence, increasing inspections, changing material delivery windows, or escalating a subcontractor coordination issue before it affects downstream trades.
This is why analytics should not be confused with simply gathering more information. A common misconception is that a company becomes data driven as soon as it digitizes forms or buys a dashboard platform. In reality, data volume alone can create noise. Useful analytics starts with a narrow question such as why an activity is repeatedly slipping, why a crew’s output changes by shift, why an area has more near misses than expected, or why one equipment class is underutilized while another becomes a bottleneck.
Once that question is clear, the jobsite can be instrumented in a more disciplined way. Daily logs, photos, telematics, inspections, RFIs, permit records, labor hours, punch items, and safety observations can then be structured to answer something specific. That is when analytics stops being administrative and starts becoming operational.
Practical rule: If a data point cannot influence a field decision, it is reporting. If it can change what the team does tomorrow, it is analytics.
Why Site Analytics Matters More Than Ever
The modern construction site is under pressure from several directions at once. Owners want certainty on cost and schedule. Regulators expect disciplined hazard control. Skilled labor remains uneven across many regions. Supply chains continue to create variability. Weather patterns, permitting timelines, and local housing demand can all change the operating context for a project faster than many teams can react. In this environment, lagging information is expensive.
OSHA’s guidance on leading indicators is particularly relevant because it frames proactive measurement as a way to improve not only safety outcomes, but also productivity and overall organizational performance. That broader perspective is important. Construction teams often separate safety metrics from schedule metrics and quality metrics, even though field conditions link them together every day. Congested work zones, rushed handoffs, equipment downtime, and unclear work packages affect both production and risk exposure.
Analytics gives teams a way to see those relationships earlier. Instead of waiting for missed milestones, incidents, rework claims, or overtime spikes, a project can monitor pre incident and pre delay signals such as inspection closeout time, work area readiness, equipment idle time, incomplete handoffs between trades, aging RFIs, heat stress exposure, and recurring access constraints. These are often small issues at first. The value of analytics is that it reveals them while they are still manageable.
Regional context also matters. A dashboard that suggests normal crew performance in one market may indicate a problem in another if labor availability, climate, or trade capacity differs. In Canada and across U.S. states and provinces, local labor conditions, housing activity, and economic indicators can change what good performance looks like. Site analytics becomes far more credible when local context is built into interpretation rather than forcing every project into a generic benchmark.
The Most Valuable Jobsite Data Sources
The strongest site analytics programs usually start with data that already exists. That is good news for smaller contractors and mid sized firms that assume analytics is only for large enterprises. In reality, practical value often comes from a few dependable sources captured consistently. The goal is not a perfect digital twin on day one. The goal is a usable picture of field reality.
Daily Logs
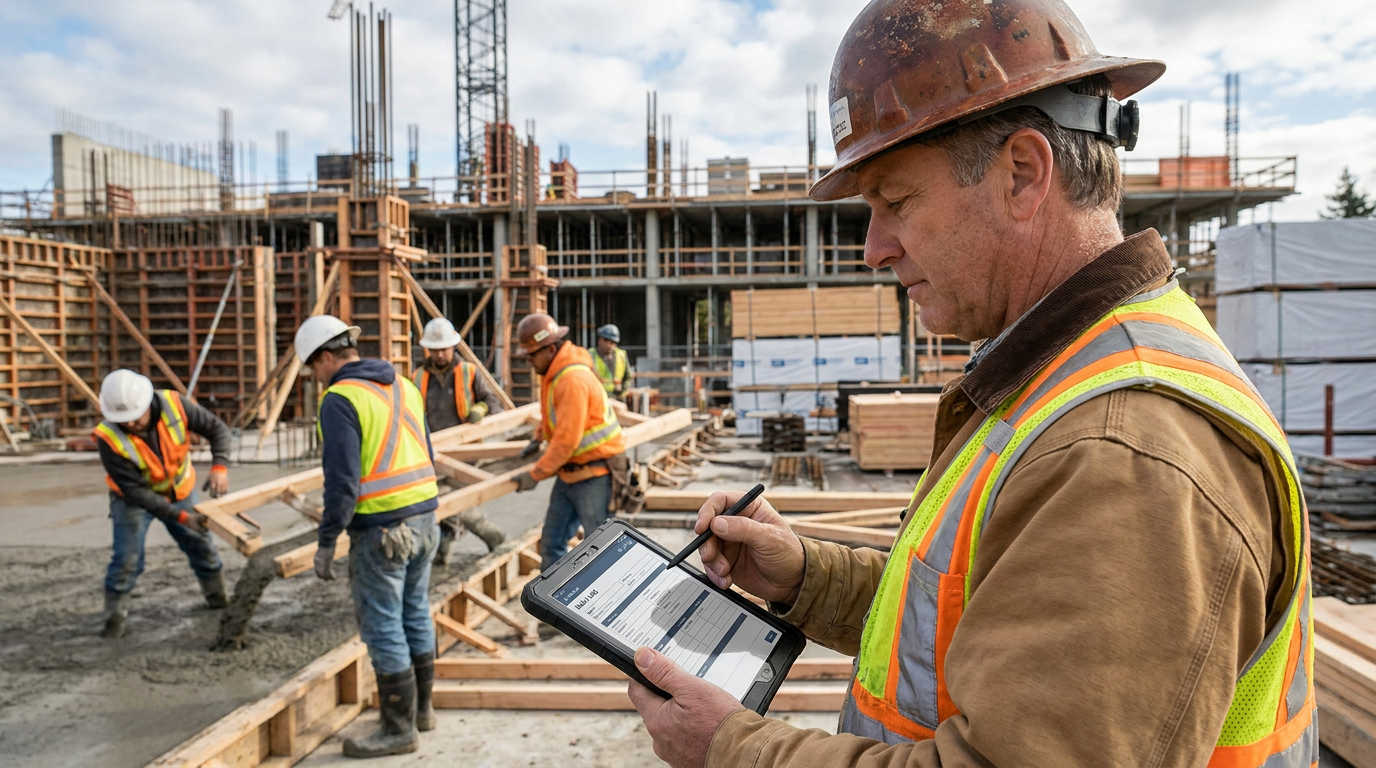
Daily logs are one of the most overlooked analytics assets in construction. When standardized well, they reveal patterns in weather disruption, trade stacking, labor availability, delivery issues, inspection delays, access problems, and productivity blockers by activity. Because they are written close to the event, they often contain the earliest evidence of emerging schedule risk.
The problem is that many daily logs are still narrative heavy and inconsistent. One superintendent writes detailed notes while another enters only a few lines. To make this information analyzable, firms need common fields for crew counts, planned versus completed work, delay codes, major constraints, equipment used, deliveries received, incidents observed, and key handoffs. A little structure turns a diary into a trend line.
Progress Photos and Visual Records
Photos document more than progress. They capture work area congestion, storage conditions, sequencing conflicts, housekeeping quality, temporary protection, and installation variance over time. When photos are time stamped, geolocated, and tagged by area or trade, they become a powerful source for comparing plan against actual site conditions.
AI assisted image analysis is making this even more useful. Teams can increasingly identify missing PPE, incomplete barriers, material accumulation, and visible deviations through automated review workflows. Human validation still matters, especially for high consequence decisions, but the practical gain is speed. Instead of manually searching thousands of images, teams can focus on exceptions that need attention.
Equipment Telematics
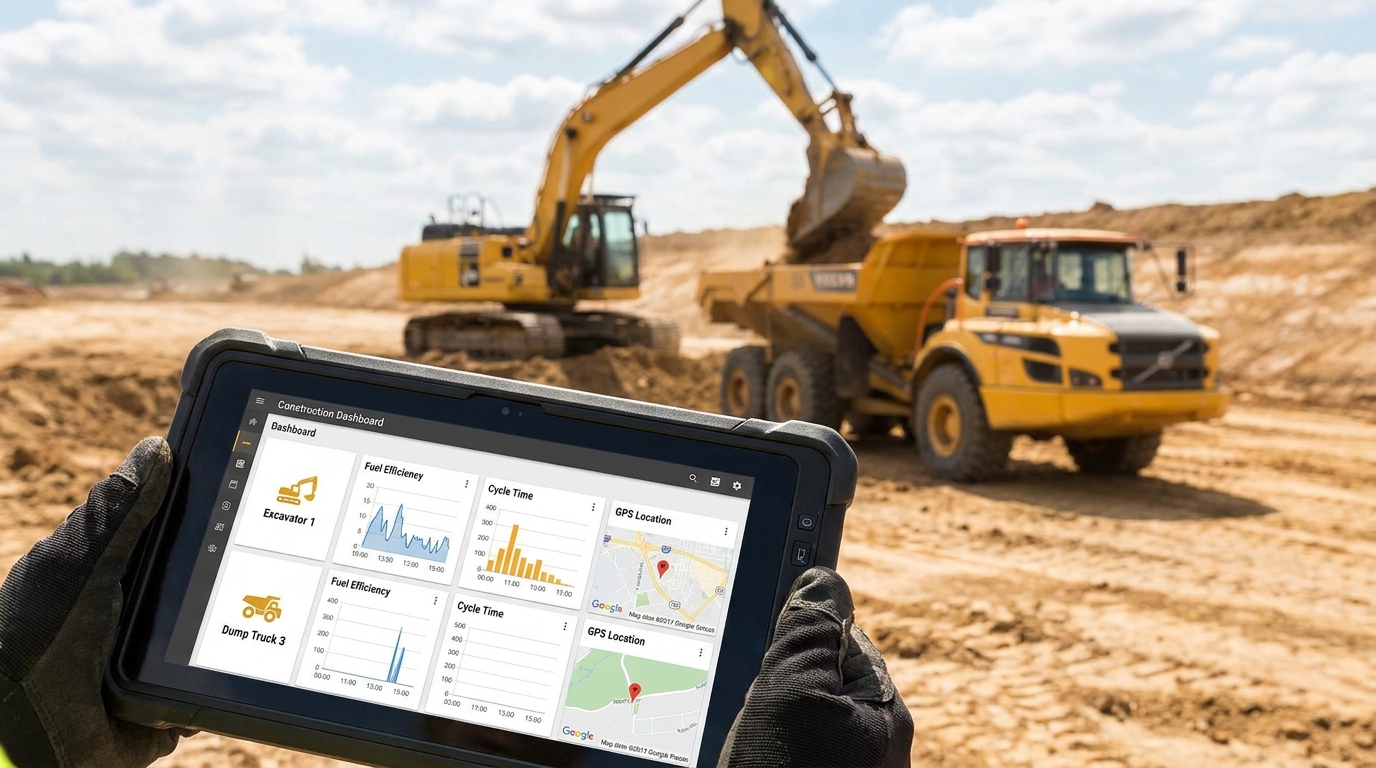
Telematics data shows how machines are actually being used. That includes engine hours, idle time, utilization rates, location, maintenance alerts, and in some cases fuel burn or operator behavior. On a project with heavy equipment, this information can quickly identify underused assets, logistics inefficiency, queue time, and maintenance risks before a breakdown disrupts the schedule.
It also helps separate perception from reality. A superintendent may feel that an excavator is overbooked, but telematics may show long idle periods caused by truck coordination or access delays. That changes the solution. Instead of renting another machine, the team may need to adjust haul sequencing, crew timing, or staging rules.
Safety Observations and Near Miss Reports
Incident counts are lagging indicators. By the time they increase, the failure has already happened. Safety observations, corrective action closeout times, toolbox talk attendance, permit compliance, exposure duration, and near miss patterns are more useful for prevention because they describe conditions that exist before harm occurs.
OSHA’s emphasis on leading indicators and written safety and health programs supports this approach directly. Hazard recognition and control are not passive functions. They depend on visible, repeated measurement. When site analytics captures how fast hazards are closed, where repeated observations are occurring, and which work packages have the highest exposure profile, safety management becomes more targeted and more credible.
Inspections, QA Records, and Rework Data
Quality analytics often receives less attention than safety or schedule, yet rework is one of the most expensive drains on project performance. Inspection pass rates, punch item density by area, recurring defect types, subcontractor variance, and closeout duration can all reveal whether a quality issue is isolated or systemic. If one work face repeatedly fails for the same reason, the project does not have a workmanship problem alone. It has an information problem, sequencing problem, supervision problem, or readiness problem that analytics can help expose.
Scheduling and Coordination Data
Analytics becomes most powerful when field data is linked to schedule logic. Planned percent complete, work package readiness, lookahead reliability, RFI aging, submittal turnaround, handoff delay between trades, and milestone slippage all help explain not just what is late, but why it is late. That is the difference between reporting a variance and managing recovery.
Leading Indicators Versus Lagging Indicators
A practical site analytics strategy depends on understanding the difference between leading and lagging indicators. Lagging indicators tell you what has already happened. They include lost time incidents, rework costs, missed milestones, budget overruns, rejected inspections, and overtime spikes. These metrics are still important because they measure outcomes. The problem is that they often arrive too late to prevent damage.
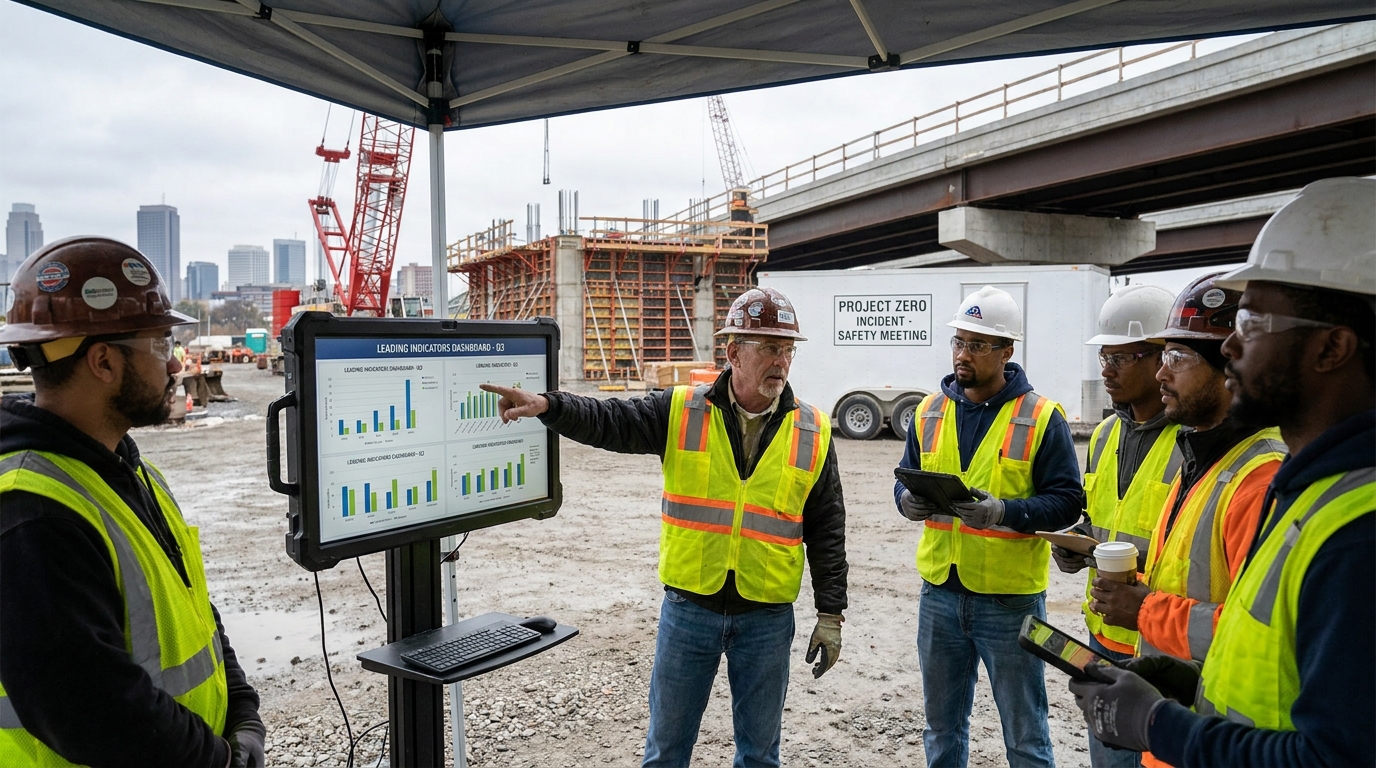
Leading indicators track the conditions and behaviors that tend to precede those outcomes. In construction, they are often more actionable because they reveal change while there is still room to intervene. OSHA’s guidance makes this especially clear by noting that leading indicators can support productivity and organizational performance, not only safety improvement. This broadens the conversation from compliance to management quality.
Examples of useful leading indicators on site include the age of unresolved constraints, the time it takes to close safety observations, the ratio of planned work packages that are actually ready, repeated access conflicts in the same zone, equipment idle time beyond a threshold, missing pre task plans, recurring late material deliveries, or weather related production drops by activity type. None of these signals guarantee a problem. They do show where the project should pay attention.
Lagging metrics answer, “What went wrong?” Leading metrics answer, “What is likely to go wrong if nothing changes?” The most mature jobsites track both. Lagging indicators validate outcomes. Leading indicators guide intervention.
How Site Analytics Improves Real Project Outcomes
The value of analytics becomes easiest to understand when tied to direct project outcomes. Teams are not investing in dashboards because charts look modern. They are trying to reduce avoidable friction on site. When field data is connected to specific decisions, analytics creates measurable operational gains.
Improving Safety Performance
Construction remains a high hazard environment, and safety analytics is one of the clearest examples of proactive management. If a project tracks only recordable incidents, it is studying failure after it occurs. If it tracks pre task planning completion, recurring observation zones, PPE compliance patterns, permit violations, housekeeping trends, and corrective action closeout speed, it can identify where controls are weakening.
For example, a project may notice that near miss reports increase during late afternoon shifts in a specific access corridor. On paper, this could look minor. In practice, it may reveal fatigue, congestion, poor lighting, or a handoff issue between trades. The response could involve route separation, altered delivery timing, refreshed signage, or schedule adjustments. Analytics gives the team a reason to act based on pattern rather than intuition alone.
Protecting Schedule Performance
Most delays do not arrive as dramatic single events. They build through small, repeated failures in readiness, coordination, approvals, and sequencing. Site analytics can expose those patterns early by combining daily log entries, lookahead commitments, RFI aging, inspection hold points, and trade handoff performance.
If one area repeatedly shows planned work that cannot start because predecessor trades are incomplete, the issue may not be labor capacity. It may be unreliable handoff discipline. If weather losses affect one activity much more than others, the team may need to rethink sequencing or temporary protection. When schedule discussions are supported by field evidence instead of only percent complete summaries, recovery planning becomes more accurate and less political.
Raising Productivity
Productivity analytics is often most effective when it starts simple. Track output by activity, crew size, shift, weather condition, and work area. Add delay reasons from daily logs. Compare utilization across similar tasks. This can reveal whether lower output is tied to congestion, material waiting time, incomplete information, equipment access, or inconsistent supervision.
ENR’s point about the underused daily log matters here because productivity insight often already exists in those records. If the same delay code appears across multiple days, that is not noise. It is a management signal. Analytics helps the team quantify recurring causes of lost production and target root causes rather than blame crews for downstream effects they cannot control.
Reducing Rework and Quality Drift
Quality issues tend to spread quietly. A repeated installation error in one area can become a closeout problem across an entire floor or structure. Site analytics helps contain that risk by mapping defects, tracking recurring failure types, and showing where inspection pass rates are declining. When this information is tied to subcontractor, crew, sequence, or design package, root causes become clearer.
Analytics also improves the timing of intervention. Instead of waiting for punch pressure near turnover, the team can identify where quality drift is beginning and respond with revised work instructions, increased supervision, mock up review, or targeted retraining. That is far cheaper than removing finished work later.
Optimizing Equipment and Logistics
Equipment and logistics are frequent sources of hidden inefficiency. A project may have enough machines, but poor dispatching, delivery timing, route planning, or fueling support can reduce actual productivity. Telematics data, gate logs, laydown utilization, and material movement records can help identify where assets or deliveries are creating friction instead of flow.
When equipment idle time is high, the answer is not always fewer machines. Sometimes the real problem is that trucks arrive unevenly, operators wait on clearance, or materials are staged too far from the work face. Site analytics helps teams make more precise adjustments and avoid expensive assumptions.
Building a Practical Site Analytics Workflow
For many firms, the hardest part is not understanding the value of analytics. It is implementing it without overcomplicating field operations. A practical workflow should be lightweight enough for consistent use and disciplined enough to support comparison over time.
The most effective approach is to start with a small set of business questions. For example, where are we losing time each week, which safety observations are recurring, what work packages are repeatedly not ready, or which equipment classes show chronic idle time. These questions define what to collect. They also prevent teams from building a broad data intake process that no one uses.
Once the questions are clear, establish a short list of standard inputs. In most cases, these include digital daily logs, crew hours, progress status by activity, safety observations, inspection results, photos, and equipment data where relevant. Standardization matters more than perfection. If every superintendent uses different terms for the same delay, analysis becomes unreliable. Common fields and simple coding structures solve this.
After collection, the workflow needs basic validation. Missing timestamps, duplicate entries, vague free text, and inconsistent area naming reduce trust quickly. Site leaders will not use analytics that feels detached from reality. A small amount of quality control at the input stage has an outsized impact on credibility later.
Finally, insights must be reviewed in a decision forum. A dashboard no one discusses has little value. Weekly coordination meetings, safety reviews, superintendent huddles, and owner updates should all have a place where analytics informs action. This is where the project decides what changes, who owns the response, and when the effect will be checked again.
The Best Tools for Site Analytics
The tool landscape is expanding quickly, but the best platform is not always the most complex. What matters is whether the system fits field reality, reduces administrative friction, and supports timely decisions. In practical terms, site analytics usually depends on a combination of field capture tools, data integration, visualization, and basic workflow automation.
Field mobility apps are often the foundation. They digitize daily logs, inspections, safety observations, issue tracking, and progress updates in a way that captures data close to the work. This alone improves consistency compared with paper forms or scattered spreadsheets. The next step is connecting these inputs with schedule data, equipment telematics, weather feeds, and cost or productivity records to create a fuller operating picture.
Dashboard tools are useful when they focus on exceptions rather than vanity metrics. A good dashboard should help a superintendent see what needs attention now. It should not force a field leader to read thirty charts to discover one urgent issue. In many cases, the most effective design is a small number of trend lines and threshold alerts supported by drill down detail.
AI assisted analysis is growing fast in this space. It can summarize daily reports, extract patterns from narrative text, classify recurring delays, and consolidate inputs from multiple systems. This can save time, especially on large projects with fragmented data sources. Still, AI should be treated as an accelerator, not a substitute for field judgment. Construction sites are context heavy environments, and local knowledge remains essential for interpretation.
Common Mistakes That Limit Analytics Value
Many construction teams adopt analytics tools but struggle to see a clear return. Usually the problem is not the idea itself. It is the operating model around it. One common mistake is collecting too much information without a clear decision use case. This creates reporting fatigue and weakens participation from the field.
Another mistake is relying too heavily on lagging metrics. If the dashboard centers only on incidents, rework totals, and end of month variance, the team is observing damage after it happens. The stronger approach is to pair these outcomes with leading indicators that show whether risk is building.
A third issue is treating analytics as an office exercise. Site intelligence must remain close to site operations. If superintendents, foremen, and safety leads do not trust the data or see it reflected in daily decisions, adoption will stay shallow. Analytics works best when field teams help define the measures, review the results, and shape the response.
There is also the mistake of using one benchmark everywhere. A labor productivity threshold that is normal in one province, state, or metro area may be unrealistic in another due to weather, union conditions, trade supply, project type, or permitting constraints. Local context is not a minor adjustment. It is part of the analytics itself.
Site Analytics for Small and Mid Sized Contractors
It is easy to assume that analytics belongs to major contractors running large infrastructure or high rise portfolios. In reality, smaller firms can often gain value faster because they can standardize processes across fewer teams and act on findings with less organizational drag. The key is to begin with a manageable scope.
A small contractor might start by digitizing daily logs, coding top delay reasons, logging safety observations through mobile forms, and reviewing planned versus completed work every week. Within a month, patterns usually begin to appear. Which subcontractor interfaces create the most delay. Which weather conditions consistently reduce output. Which areas generate repeated quality issues. None of this requires a data science department.
As maturity grows, firms can add telematics, visual documentation, inspection analytics, and simple forecasting rules. What matters most is management discipline. The fastest return often comes not from advanced technology, but from consistent review and follow through. Analytics only creates value when it changes behavior.
Regional Context Across Canada and North America
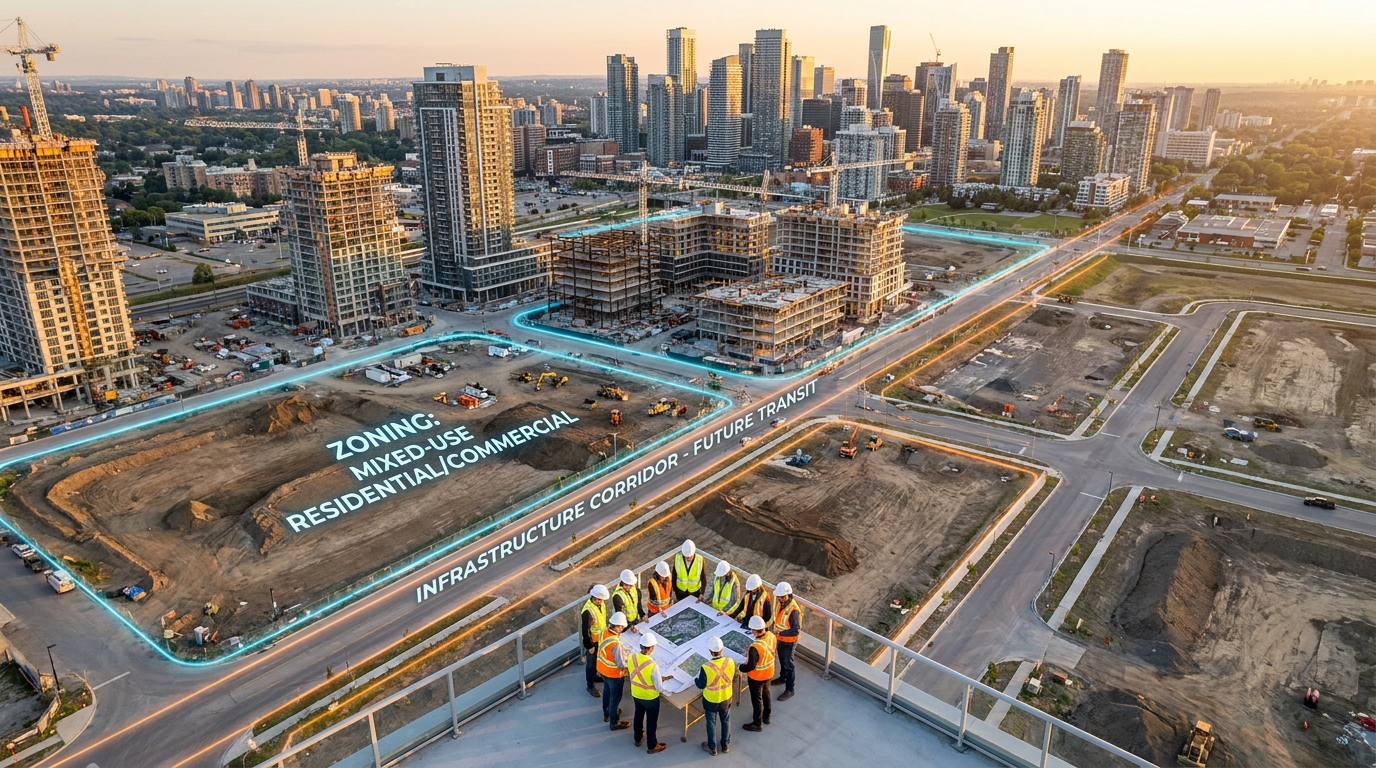
Construction performance is local by nature. Site analytics becomes more useful when it respects that reality. A project in Alberta, Ontario, Texas, or British Columbia may face very different labor dynamics, weather windows, permitting timing, material lead times, and housing or infrastructure demand. Those conditions influence how dashboards should be read.
This is one reason regional benchmarking is becoming more important. Broader market data can help teams understand whether rising labor hours reflect internal inefficiency or a wider trade shortage. Weather adjusted performance baselines can prevent overreaction to normal seasonal disruption. Local economic indicators can also shape procurement and sequencing decisions before field problems intensify.
For owners and portfolio managers, this means site analytics should not be isolated from market intelligence. The strongest construction intelligence models link project level signals with regional conditions. A delayed project is not always a badly managed project. Sometimes it is operating in a market with severe capacity constraints. Good analytics helps distinguish between the two.
How to Start Using Site Analytics on Your Next Project
If you are building or improving a site analytics process, start with clarity and restraint. Choose a small number of questions that matter to project outcomes. Decide what data is needed to answer them. Standardize how that data is captured. Review it on a fixed cadence with field leaders present. Then connect each insight to an action and measure whether the action worked.
-
Define three to five operational questions tied to safety, schedule, productivity, quality, or equipment use. Keep them specific enough to guide collection.
-
Standardize core inputs such as daily logs, delay codes, crew counts, safety observations, progress status, and inspection results.
-
Use a simple dashboard that highlights exceptions, trends, and unresolved constraints rather than overwhelming the team with every possible metric.
-
Review leading indicators weekly and lagging indicators monthly so the team can act early while still validating long term outcomes.
-
Document response actions, owners, and due dates. Analytics without accountability is just a well designed archive.
As the process matures, expand carefully. Add telematics if equipment cost or utilization is a major issue. Add photo analytics if quality drift or safety compliance needs better visibility. Add forecasting if repeated patterns give enough history to support useful prediction. The right path is incremental, not theatrical.
The Future of Construction Intelligence on Site
Site analytics is moving toward more integrated, more automated, and more predictive workflows. AI assisted reporting, connected equipment, sensor based monitoring, computer vision, and one click field capture are all making it easier to convert site activity into usable intelligence. The trend is not just about speed. It is about reducing the gap between what happens in the field and what leaders know in time to respond.
Even so, the core principle is staying the same. Construction intelligence is most valuable when it supports practical action. A future system may automatically summarize logs, detect congestion in images, compare progress against schedule, and flag rising heat exposure across a crew. That is useful only if the project changes staffing, sequence, controls, or logistics based on those insights. Technology improves signal detection. Management still determines impact.
In that sense, site analytics is not replacing site leadership. It is sharpening it. It gives superintendents, project managers, safety professionals, and owners a clearer view of what the jobsite is telling them every day. In a high hazard, high pressure industry, that clarity is a competitive advantage.
Conclusion
Maximizing construction success with site analytics is less about building a sophisticated reporting environment and more about making better decisions earlier. The most effective programs turn ordinary field information into leading indicators that guide action on safety, productivity, quality, schedule, logistics, and cost. They connect data to accountability, and accountability to improved outcomes.
For construction teams across Canada and North America, the message is practical. Start with the data you already have. Standardize it. Focus on leading indicators as well as outcomes. Interpret performance in its local context. Most importantly, use analytics to decide what changes on site tomorrow, not simply what happened yesterday.
That is where site analytics delivers its real value. It helps projects move from observation to intervention, from reporting to intelligence, and from reactive management to informed control. In a sector where small delays compound and unmanaged risk can become expensive very quickly, that shift can make the difference between a project that struggles and one that performs with discipline.


No Comment! Be the first one.