



Investment decisions used to feel distant from everyday life. Market data lived in brokerage terminals, research reports were difficult to access, and serious analysis seemed reserved for professionals in towers filled with screens. That picture has changed. Today, ordinary investors can open an app, view performance across accounts, compare holdings with an index, and receive instant notifications about market moves. The challenge is no longer finding information. The challenge is knowing which signals matter and how to use them without getting overwhelmed.
Table Of Content
- What Investment Analytics Actually Means for Everyday Investors
- Why Digital Investing Has Made Analytics More Important
- The Core Decisions Investment Analytics Helps You Make
- 1. Understanding what you actually hold
- 2. Measuring risk instead of guessing it
- 3. Comparing performance to an appropriate benchmark
- 4. Tracking fees and cost drag
- 5. Reviewing tax impact
- The Metrics That Matter Most
- Why Price Alone Does Not Tell the Full Story
- How AI Is Changing Investment Analytics
- Practical Tools Everyday Investors Can Use Right Now
- Portfolio aggregation
- Rebalancing alerts
- Fee and MER analysis
- Dividend and tax tracking
- Scenario testing and retirement projections
- Building a Repeatable Analytics Routine
- A Simple Framework for Smarter Decisions
- Common Mistakes to Avoid
- How Investment Analytics Supports Long Term Wealth Building
- Final Thoughts
Investment analytics is the discipline of using data, statistics, and digital tools to understand what you own, how it behaves, and whether it supports your goals. It is not about building hedge fund models or predicting every market move. For most households, it is about asking better questions. Are you too concentrated in one sector. Are fees quietly reducing your long term growth. Has your portfolio drifted away from your intended mix. Are you comparing your returns to the right benchmark. Analytics helps turn those questions into repeatable decisions.
This matters more in a digital investing environment. In the FCAC and CIRO investor survey, 68% of Canadians preferred receiving investment information through digital channels, while only 15% preferred meeting with an advisor and another 15% preferred paper statements. That tells us something important. Investors are already living inside dashboards, portals, and app based summaries. The practical skill is not simply accessing more numbers. It is learning how to interpret numbers with discipline, context, and enough skepticism to avoid being nudged into bad decisions.
That is where modern investment analytics becomes useful. It helps investors compare portfolio performance against benchmarks, estimate risk exposure, monitor diversification, track taxes and dividends, and spot whether cost drag is hurting results. It also creates a framework for decision making during periods of volatility. Instead of reacting to headlines, an investor can use analytics to ask whether their portfolio still aligns with their target allocation, time horizon, and risk tolerance.
This guide explains how everyday investors can use investment analytics in practical ways. You do not need advanced mathematics, coding skills, or institutional resources. What you need is a process. When used well, analytics does not replace judgment. It improves judgment by making your decisions more visible, more measurable, and less emotional.
What Investment Analytics Actually Means for Everyday Investors
The term investment analytics can sound technical, but its practical meaning is straightforward. It is the use of structured information to make financial choices more informed. That includes simple measures like portfolio returns, sector weightings, and account balances. It also includes more useful decision layers such as volatility, drawdown, benchmark comparison, tax impact, fee analysis, and concentration risk.
For an everyday investor, the point is not to monitor every fluctuation. The point is to answer a few high value questions with greater accuracy. You may want to know whether your retirement portfolio is too aggressive for your stage of life. You may want to understand whether your U.S. holdings have become too large relative to Canadian exposure. You may want to test whether switching from higher fee mutual funds to lower cost ETFs would improve long term compounding. These are all analytics questions because they rely on evidence, not intuition alone.
Regulators increasingly emphasize that data should improve investor judgment rather than replace it. The SEC’s investor education resources consistently frame informed decision making as a process of reviewing goals, understanding risk, and resisting emotional reactions in volatile markets. That is an important distinction. Analytics is not a machine that tells you what to buy next. It is a toolkit that helps you understand whether your choices are coherent.
The same logic applies to broader market understanding. The Bank of Canada treats financial markets as a core part of the financial system and monitors them using research, market data, and financial stability indicators. For retail investors, that does not mean tracking central bank dashboards every day. It means recognizing that your individual securities exist within a larger market structure shaped by rates, liquidity, credit conditions, and sentiment. Analytics bridges the gap between the individual asset and the environment around it.
Why Digital Investing Has Made Analytics More Important
The rapid shift toward digital investing has given people more immediate access to information than ever before. Brokerage apps, robo advisors, and portfolio dashboards can display your gain or loss in seconds. They can show news headlines next to positions, rank your best and worst performers, and send alerts that make action feel urgent. This convenience is valuable, but it also compresses the distance between emotion and execution.
That is why analytics matters in a modern context. Instant access to data can either improve discipline or encourage impulsive behavior. If you open an app and only see short term price changes, you are more likely to think like a trader even if your real goal is retirement planning. If you open an analytics dashboard that shows your target allocation, benchmark progress, dividend history, and annualized return after fees, you are more likely to think like a long term investor.
There is also an important warning here. Recent research and regulatory attention around predictive analytics and platform design suggests that recommendation engines may not always be neutral. Some digital systems are optimized for engagement, activity, or product uptake rather than investor welfare. That means a nudge, a highlighted stock, or a personalized prompt may reflect commercial incentives as much as objective analysis. Everyday investors should understand that analytics can support discipline, but platform design can also push in the opposite direction.
A practical response is to create your own decision framework before opening the app. Instead of asking what is moving today, ask what changed relative to your plan. Instead of responding to every alert, review whether the signal affects your diversification, valuation discipline, tax position, or long term goal. The more structured your process, the less likely you are to confuse platform activity with real investment progress.
The Core Decisions Investment Analytics Helps You Make
Good analytics is not about collecting endless metrics. It is about selecting the right information for the right decision. For most investors, the highest value use cases are remarkably consistent. You want to understand what you own, how much risk you are taking, whether your returns justify your costs, and whether your portfolio still reflects your goals.
1. Understanding what you actually hold
Many investors believe they are diversified because they own multiple funds. Analytics often reveals that several of those funds hold the same large companies, sectors, or geographies. A portfolio can look broad on the surface while still being concentrated under the hood. This is especially common when people combine market index funds, sector products, thematic ETFs, and employer stock without checking overlap.
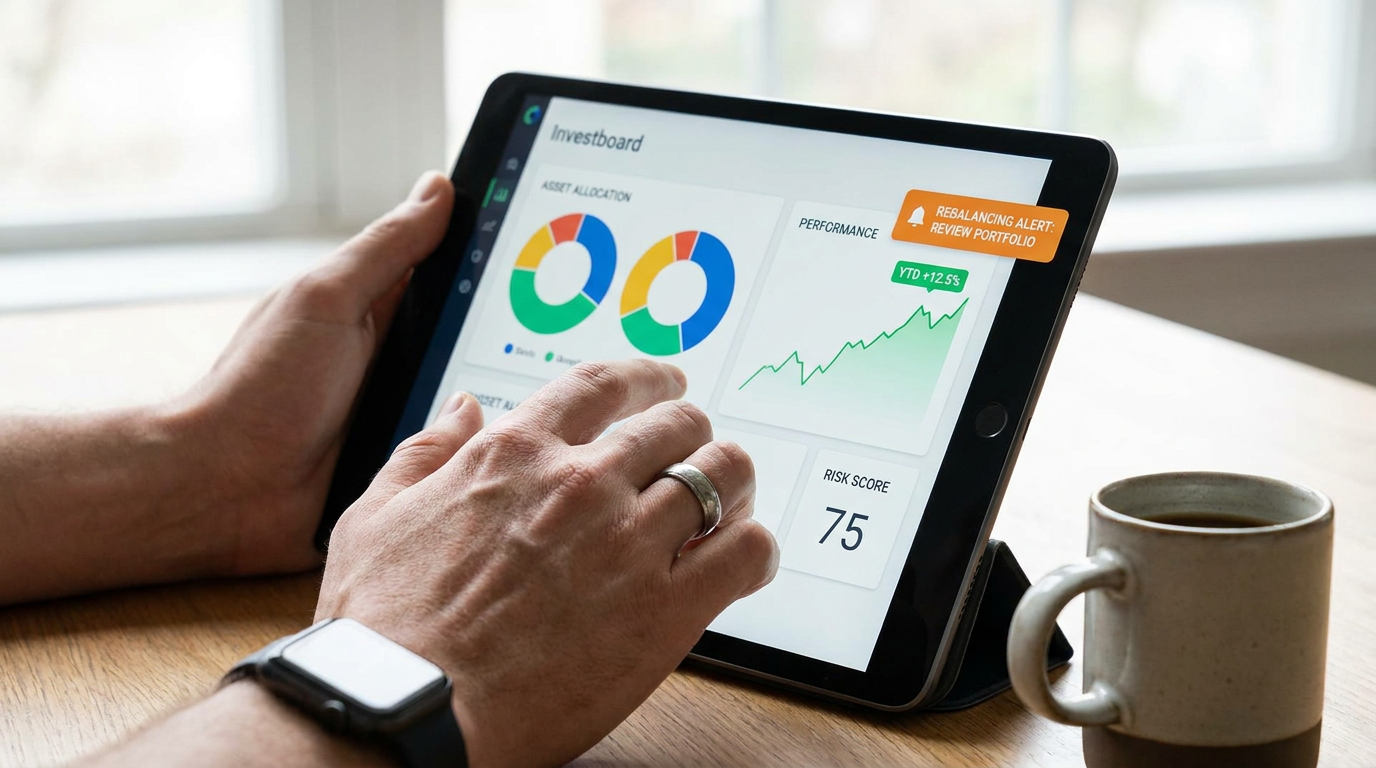
Portfolio aggregation tools can help by combining holdings across accounts and showing exposure by asset class, sector, region, currency, and issuer concentration. This matters for households that invest through RRSPs, TFSAs, taxable accounts, and workplace plans at the same time. Without aggregation, it is easy to underestimate concentration because each account appears manageable in isolation. Analytics gives you the whole picture.
2. Measuring risk instead of guessing it
Risk tolerance is often discussed in abstract terms, but analytics makes it concrete. A dashboard can show portfolio volatility, historical drawdowns, stock to bond allocation, sector concentration, and geographic balance. These are not perfect forecasts, but they are useful indicators of how your portfolio may behave under stress.
One of the most common mistakes investors make is assuming they can handle risk because markets have been calm. Real tolerance only becomes visible during declines. If your portfolio drops 18% and you suddenly want to sell everything, your actual risk tolerance may be lower than your theoretical one. Analytics helps by showing whether your portfolio design matches the level of fluctuation you can realistically endure.
3. Comparing performance to an appropriate benchmark
Returns are hard to interpret without context. A portfolio that gained 7% may sound strong until you realize a comparable benchmark returned 11%. On the other hand, a portfolio that lost 4% might have performed well if a balanced benchmark lost 8%. Benchmarking prevents both false confidence and unnecessary disappointment.
The key is to choose a benchmark that actually resembles your strategy. A globally diversified retirement portfolio should not be judged against a single high growth technology index. A conservative income portfolio should not be compared with an aggressive equity benchmark. Analytics platforms can automate this comparison, but the investor still needs to select a benchmark that reflects the role of the portfolio, not the most flattering reference point.
4. Tracking fees and cost drag
Fees are one of the clearest areas where analytics improves outcomes. Expense ratios, management expense ratios, advisory fees, currency conversion charges, and trading costs can quietly reduce long term growth. The effect can seem small in one year but becomes meaningful over decades.
Fee analysis tools help investors estimate how much of their gross return is being lost to costs. This is especially useful when comparing similar products. If two funds provide similar exposure but one costs significantly more, the performance hurdle for the more expensive option becomes harder to justify. Analytics turns a vague sense that fees matter into a measurable number.
5. Reviewing tax impact
Taxes can shape net returns as much as market performance. Analytics can help track realized gains, dividend income, account location, and the after tax effect of trading decisions. For Canadian investors using taxable accounts alongside registered plans, this is particularly important. The same investment can produce very different results depending on where it is held and how frequently it is traded.
Tax awareness does not mean making every choice for tax reasons alone. It means understanding the consequences before acting. Selling a position late in the year, harvesting a loss, or shifting income producing assets between account types can all have meaningful effects. A good analytics platform can highlight these factors so you are not evaluating returns in pre tax isolation.

The Metrics That Matter Most
Every investor does not need an advanced factor model, but there are a handful of analytics measures worth understanding because they speak directly to decision quality. The most useful metrics are the ones that change behavior in a constructive way. They help you refine allocation, reduce unnecessary cost, and stay aligned with your plan.
- Asset allocation shows how your money is distributed across equities, fixed income, cash, and alternatives.
- Sector and geographic exposure reveals concentration that may not be obvious from fund names alone.
- Volatility gives a sense of how sharply your portfolio tends to move over time.
- Maximum drawdown shows the largest historical decline from peak to trough.
- Expense ratio or MER quantifies product level cost drag.
- Benchmark relative return helps assess whether performance should be interpreted as strong, weak, or simply different.
- Dividend and income tracking is useful for investors with cash flow goals.
- Turnover or trading frequency can reveal whether activity is undermining discipline.
Notice what is not on this list. The one day move of a stock is not a core planning metric. Nor is a headline target price from a stranger on television. Short term information can be interesting, but it rarely improves the long term decisions that determine household wealth. Analytics works best when it emphasizes structural signals over noise.
The most useful investment data answers a decision you already need to make. If a metric does not affect allocation, cost control, risk management, or long term planning, it may be information without value.
Why Price Alone Does Not Tell the Full Story
One of the most persistent misconceptions in investing is that a quote tells the whole truth. A stock is up 2%, down 4%, or unchanged, and that becomes the story. In reality, price is only one visible layer of a much deeper market structure. The SEC’s Division of Economic and Risk Analysis uses financial economics and statistical analysis to identify market issues, trading strategies, new product risks, systemic vulnerabilities, and fraud. That alone should remind investors that markets are more complex than a ticker suggests.
The SEC’s MIDAS system reinforces this point. It exists because common market headlines and standard consolidated tape data do not show all the smaller trades, order book details, and execution conditions that influence what is really happening beneath the surface. Everyday investors do not need to study market microstructure in depth, but they should understand the practical implication. A visible price move may not tell you much about liquidity, spread quality, or execution conditions.
This matters especially when investing in less liquid securities, niche ETFs, or fast moving markets. If you buy or sell without considering spreads and execution quality, your actual transaction result may be worse than the headline price suggests. Analytics platforms that show average spreads, liquidity indicators, and trading volume patterns can help investors avoid hidden friction. This is one reason limit orders and patient execution can matter, particularly outside highly liquid large cap names.
For long term investors, the lesson is simple. Do not confuse the most visible data point with the most important one. Price is useful, but it is not complete. Better decisions come from pairing price with context, diversification analysis, valuation discipline, and an understanding of how a security fits into the rest of the portfolio.
How AI Is Changing Investment Analytics
Artificial intelligence is reshaping how financial information is processed, summarized, and delivered. The CFA Institute notes that data science, AI, and machine learning are becoming increasingly important in investment work because modern markets are more data rich and less dependent on privileged information. The Bank of Canada has also documented increasing use of non traditional data and AI to extract insights from text, images, and real time transactions. This shift is not theoretical. It is already influencing how research tools, brokerage platforms, and financial dashboards operate.
For everyday investors, AI can be genuinely helpful. It can summarize earnings calls, classify spending and dividends, detect changes in portfolio concentration, estimate scenario outcomes, and simplify comparison across products. It can reduce friction by turning raw data into readable insights. A beginner who feels intimidated by spreadsheets may gain confidence from an interface that translates complex patterns into plain language.
But AI also requires caution. AI generated investment suggestions are not automatically objective. Recommendation systems may reflect incomplete data, training biases, or commercial incentives embedded in the platform. Predictive analytics can create conflicts of interest if a system is designed to maximize engagement, encourage frequent trading, or steer users toward profitable products for the provider. That is why AI should be treated as a decision aid, not a decision substitute.
A useful rule is to ask three questions whenever an AI tool gives a recommendation. What data is it using. What goal is it optimizing for. What would have to be true for this suggestion to be wrong. These questions bring the investor back into the process. Analytics becomes most valuable when it sharpens critical thinking rather than replacing it.

Practical Tools Everyday Investors Can Use Right Now
The best investment analytics tools are not necessarily the most advanced. They are the ones you will actually use consistently. For most people, a practical toolkit combines account aggregation, performance reporting, rebalancing awareness, and cost tracking. Whether the interface is a brokerage dashboard, a robo advisor portal, a spreadsheet, or a specialized portfolio app matters less than the clarity of the process.
Portfolio aggregation
If your investments are spread across multiple accounts or institutions, start by bringing them into one view. Aggregation helps you see total exposure rather than fragmented balances. It also reduces the risk of accidentally duplicating holdings or drifting too far from your intended allocation. Many investors are surprised to discover that separate accounts have collectively created more concentration than they realized.
Rebalancing alerts
Rebalancing tools show when market movements have pushed your portfolio away from its target weights. This is one of the most practical uses of analytics because it creates discipline. Instead of buying what feels exciting or selling what feels scary, you can use predetermined allocation bands to guide action. Rebalancing is not exciting, but it often does more for long term behavior than prediction ever could.
Fee and MER analysis
Most investors understand that costs matter in theory. Analytics makes the effect visible in dollars. A fee dashboard can compare product costs, estimate the annual drag on your current balance, and project the long term difference between lower and higher fee options. This often becomes one of the clearest opportunities for improvement because reducing cost does not require forecasting the market correctly.
Dividend and tax tracking
Investors focused on income, retirement planning, or taxable accounts benefit from analytics that tracks distributions, withholding, and realized gains. This helps distinguish between headline return and cash flow quality. It also creates a better foundation for decisions about withdrawal planning, account placement, and trade timing.
Scenario testing and retirement projections
Scenario analysis helps answer questions that matter more than daily prices. What happens if returns are lower than expected for five years. What if inflation stays elevated. What if you increase contributions by 10%. What if retirement starts three years earlier. These are planning questions, and analytics can make them visible. Good tools do not pretend to know the future. They show how different assumptions might affect outcomes so you can plan with wider awareness.
Building a Repeatable Analytics Routine
The most effective investors usually do not analyze constantly. They analyze consistently. A repeatable routine is more useful than sporadic bursts of attention triggered by market stress. The goal is to create a rhythm that lets you review meaningful data without becoming trapped by noise.
A monthly review can be enough for many households. During that review, check your current allocation, compare it to your target, note any meaningful drift, and review your performance relative to a suitable benchmark. Examine whether any single holding, sector, or geography has become too large. Look at contributions, withdrawals, and any fees incurred. If you are using taxable accounts, review realized gains and income events as well.
Quarterly, you can go a bit deeper. Revisit your benchmark assumptions, review whether your risk level still fits your time horizon, and ask whether any changes in life circumstances should affect your strategy. Analytics is only useful when linked to real goals. A marriage, home purchase, job change, inheritance, or planned retirement can matter more than a quarter of market volatility.
Annual reviews are ideal for larger strategic decisions. This is the moment to examine total cost, account structure, tax efficiency, and whether your current portfolio design still serves the future you are planning for. Long term investing works best when the process is calm, documented, and hard to derail.
A Simple Framework for Smarter Decisions
If you want to make investment analytics actionable, use a framework that turns data into decisions. A simple five part structure works well for most investors because it balances clarity with depth.
- Define the goal. Know whether the portfolio is for retirement, near term savings, education funding, or income generation.
- Choose the benchmark. Select a reference point that matches the portfolio’s role and risk profile.
- Measure the risk. Review allocation, concentration, volatility, and drawdown exposure.
- Track the drag. Include fees, taxes, spreads, and unnecessary turnover.
- Document the reason for each action. If you cannot explain why a trade improves the plan, it may be noise rather than strategy.
This framework is powerful because it prevents data from floating without context. A return figure means little unless tied to a goal and benchmark. A new trade means little unless it improves diversification, valuation, or alignment with your plan. Documentation is especially valuable because it exposes emotional decision making. When investors write down why they bought or sold something, weak reasoning becomes easier to spot.
Use the right data for the right decision. More information does not guarantee better investing. Better structure does.
Common Mistakes to Avoid
Even good tools can produce bad outcomes if they are used carelessly. One common mistake is treating analytics as a live entertainment feed rather than a planning system. Constant checking can increase anxiety without improving results. Another is focusing on what is easiest to see, such as recent performance, while ignoring what matters more, such as concentration, fees, and tax impact.
Another mistake is relying too heavily on AI summaries or platform suggestions without asking how those outputs were generated. Convenience can create false confidence. Investors should remain alert to commercial incentives, model limitations, and the possibility that a recommendation is optimized for activity rather than suitability. A polished interface is not proof of sound advice.
There is also the risk of overfitting your decisions to recent market conditions. If a strong sector has outperformed for a year, analytics may show increasing weight in that area. The right response is not always to add more simply because it is working. Often the more disciplined move is to review whether concentration has become excessive relative to your plan. Data should support discipline, not chase momentum blindly.
How Investment Analytics Supports Long Term Wealth Building
Long term wealth rarely depends on one brilliant call. It usually comes from consistent contributions, sensible asset allocation, diversified exposure, cost control, and the ability to avoid self inflicted mistakes. Investment analytics strengthens each of these habits. It helps you see when your portfolio has drifted, when your costs are too high, when your benchmark is inappropriate, and when your actions are being shaped more by emotion than evidence.
This is especially relevant for households managing retirement savings across Canadian and U.S. markets. Registered and taxable accounts, currency exposure, dividend flows, and different product structures all create complexity that can be hard to manage casually. Analytics does not remove uncertainty, but it makes the moving parts clearer. That clarity can be the difference between a portfolio that feels confusing and one that feels governable.
It also improves confidence. Beginners often believe that confidence comes from predicting markets correctly. In practice, confidence usually comes from understanding your process. When you know why you hold what you hold, how risk is measured, what benchmark you are using, and what your costs are, market volatility becomes easier to interpret. You may still feel uncertainty, but you are less likely to feel lost.
Final Thoughts
Investment analytics is not about becoming a full time market technician. It is about using evidence to make ordinary financial decisions more intelligently. In a world of digital portals, AI generated summaries, instant alerts, and constant market noise, analytics gives investors something more valuable than speed. It gives them structure.
The practical benefits are clear. You can understand what you really own, measure whether your risk matches your goals, compare results against a sensible benchmark, reduce fee drag, and consider tax consequences before taking action. You can also recognize the limits of headline prices and approach AI driven recommendations with healthy skepticism. None of this requires institutional scale. It requires attention to the right signals.
For everyday investors, that may be the most important shift of all. Smart financial decisions are rarely the product of more excitement. They are usually the result of clearer information, better habits, and decisions that can be repeated under uncertainty. Investment analytics, used well, helps you build exactly that kind of discipline.



No Comment! Be the first one.