



Real estate investing has always rewarded those who can see around corners. In the past, that often meant relying on experience, local relationships, instinct, and a strong reading of market sentiment. Today, the edge is increasingly found in predictive analytics, a disciplined approach that uses historical and current data to estimate future outcomes such as home prices, rent growth, vacancy, absorption, liquidity, and the likely performance of a given asset under different market conditions. For investors operating in Canada and across North America, this shift is not a passing trend. It is becoming a core capability.
Table Of Content
- What Predictive Analytics Means in Real Estate
- Why Predictive Analytics Matters More in the Current Market
- The Data That Matters Most
- Core Variables Investors Should Track
- From National Headlines to Neighbourhood-Level Opportunity
- How Investors Actually Use Predictive Analytics
- What a Practical Predictive Workflow Looks Like
- Scenario Analysis and Stress Testing
- Common Misconceptions That Distort Investment Decisions
- Building a Smarter Investment Strategy
- Conclusion: Better Data, Better Questions, Better Outcomes
The case for predictive analytics is especially compelling in a market that is more fragmented, more data-rich, and more interest-rate sensitive than many investors expected. According to CMHC’s 2026 Housing Market Outlook, Canadian housing demand is expected to remain low, home prices are projected to show only modest gains after falling in 2025, and new home construction is forecast to decline through 2028 due to higher borrowing costs, weaker demand, slower population growth, and broad uncertainty. At the same time, CREA reported national inventory at 4.8 months in May 2026, with the National Composite MLS® Home Price Index down 4.1 percent year over year. Those are not conditions that reward loose assumptions. They reward precision.
That is where predictive analytics becomes valuable. It does not remove uncertainty, and it certainly does not predict exact selling prices with perfect accuracy. What it does is improve decision quality by converting broad market signals into measurable probabilities, comparable scenarios, and investment choices grounded in data rather than noise. A disciplined investor can use predictive modeling to test expected rent growth, estimate vacancy pressure, stress financing assumptions, compare submarkets, and evaluate whether return potential justifies the risk.
This matters because many of the strongest opportunities in real estate are no longer obvious from headline trends alone. National averages can be useful for setting context, but they often hide the dynamics that actually determine investment outcomes. Ontario and British Columbia, for example, are expected by CMHC to remain weaker than their 10 year averages, while the Prairies and Quebec are projected to remain above historical averages. A buyer who relies on a national average may see the market as flat or uncertain. A buyer using predictive analytics may see selective strength, stronger rental resilience, or better risk-adjusted entry points in specific metros and neighbourhoods.
In practical terms, predictive analytics helps investors answer the questions that matter most. Is the purchase price supported by local income and demand? Will rents grow fast enough to offset financing costs and operating expenses? Is supply arriving in this submarket likely to pressure occupancy? Is current softness temporary or structural? Is the asset better suited for near-term income, medium-term appreciation, or a refinancing strategy? These are strategic questions, and the investors who can answer them with evidence rather than optimism are positioned to outperform.
Predictive analytics does not eliminate risk. It sharpens how investors measure it, price it, and act on it.
For Canadian investors in particular, the timing is important. Government and industry data have become more granular, more frequent, and more useful. Statistics Canada has expanded coverage in the New Housing Price Index and updated methodology for the New Housing Market Report, while CMHC continues to publish scenario-based outlooks and market-specific forecasts. This improving data environment means predictive analytics is moving from a specialist tool to a mainstream investment discipline. In a market defined by shifting affordability, regional divergence, and tighter margins, that is exactly where it belongs.

What Predictive Analytics Means in Real Estate
At its core, predictive analytics is the use of data to estimate future outcomes. In real estate, that means taking a wide range of variables such as sale prices, rental rates, inventory levels, new supply, mortgage costs, days on market, absorption, employment trends, and demographic movement, then using those inputs to estimate what is likely to happen next. The objective is not to forecast one exact future. The objective is to identify the most probable range of outcomes and the conditions that could change them.
That distinction is important because one of the biggest misconceptions in the market is that predictive analytics functions like a crystal ball. It does not. It cannot tell an investor the exact selling price of a condo twelve months from now or the precise vacancy rate of a rental building in a given quarter. What it can do is estimate a likely range based on patterns, relationships, and current conditions. That is already a substantial advantage over making decisions from anecdotal commentary, generic headlines, or assumptions formed in a very different rate environment.
Predictive models in real estate usually draw from several analytical approaches. Some are relatively straightforward time-series models that look at how prices, rents, or inventory have moved over time. Others are hedonic pricing models that estimate value based on property features, location, and market conditions. More advanced investors may use machine learning techniques to identify non-linear relationships, particularly when screening larger portfolios or testing multiple acquisition targets across several metros. Regardless of complexity, the principle remains the same. Better inputs and better assumptions generally produce better investment decisions.
For individual investors, predictive analytics does not require a large institutional platform to be useful. Even a disciplined spreadsheet model can improve outcomes if it incorporates the right variables. A thoughtful investor can combine public data from CMHC, CREA, Statistics Canada, and North American affordability indicators with local intelligence on rents, inventory, employment, and supply pipeline. The goal is not technological sophistication for its own sake. The goal is a more accurate reading of value, cash flow resilience, and timing.
Why Predictive Analytics Matters More in the Current Market
Real estate cycles become more revealing when borrowing costs rise and affordability compresses. In low-rate environments, many acquisitions appear viable because cheap financing can cover a wide range of underwriting weaknesses. In a more constrained market, errors become more expensive. If rent growth slows, if vacancy rises, or if refinancing occurs at a higher cost than expected, the difference between a sound investment and a weak one becomes very clear. Predictive analytics helps investors model those pressures before capital is committed.
Recent Canadian data reinforces that point. CREA’s May 2026 market commentary noted signs of price stabilization, with the smallest year-over-year HPI decline of 2026 so far and months of inventory close to the long-term average of five months. That is a useful signal, but it should not be interpreted as a blanket green light. Stabilization in a national statistic may still conceal highly uneven local performance. Some markets may be near a floor, some may still be digesting excess supply, and others may be supported by stronger in-migration or tighter rental conditions. A predictive framework allows investors to separate those narratives.
The broader North American affordability backdrop adds another layer. The National Association of REALTORS® Housing Affordability Index, tracked through FRED, stood at 105.6 in May 2026. That suggests a median-income U.S. family had only slightly more than enough income to qualify for a median-priced home under the index assumptions. Even though this is a U.S. measure, it matters to Canadian investors because affordability, mortgage pricing, migration flows, capital availability, and investor sentiment often move across borders. When affordability deteriorates, ownership demand can soften, rental demand can strengthen, and the margin for error on leveraged acquisitions narrows.
This is one reason investors are paying more attention to cash-flow resilience than simple appreciation stories. Statistics Canada’s 2026 study on residential real estate investors found that from 2011 to 2021, Canadian property prices rose 98.4 percent while rent increased 42.6 percent. That gap matters. It shows why return analysis cannot be built on price appreciation alone. If values move faster than rents for a prolonged period, yields compress, financing sensitivity rises, and total return becomes more dependent on acquisition discipline, holding costs, tax treatment, and exit timing.
The Data That Matters Most
A strong predictive process usually starts with market-level indicators and then narrows to metro, neighbourhood, and asset-level variables. At the top of the funnel are broad economic and housing metrics that help frame the cycle. These include interest rates, inflation, employment growth, migration patterns, consumer confidence, and affordability measures. In Canada, CMHC outlooks, CREA market releases, and Statistics Canada housing publications provide a structured foundation for this layer of analysis.
For supply and pricing trends, the New Housing Market Report and the New Housing Price Index are especially useful. Statistics Canada describes the New Housing Market Report as a quarterly snapshot designed to support economists, builders, developers, policymakers, and the real estate industry. Its relevance for investors is straightforward. It helps show where new product is being delivered, where pricing pressure is changing, and how conditions in the primary market may spill into resale inventory, rent competition, and future absorption. The New Housing Price Index is also valuable because it is sensitive to supply and demand changes and useful for market comparison and forecasting.
At the regional level, predictive analytics should focus on variables that are closely tied to real investment outcomes. These often include months of inventory, days on market, active listing growth, new listings flow, rent growth, vacancy trends, local employment expansion, population growth, and the near-term development pipeline. Investors should also watch the composition of demand. A submarket driven mainly by first-time buyers behaves differently from one influenced by downsizers, students, institutional rental demand, or immigration-related household formation.
At the asset level, the model becomes more specific. Unit mix, age, maintenance profile, renovation potential, operating cost structure, tenant turnover, parking income, and neighbourhood comparables all affect projected return. This is where predictive analytics becomes especially useful in underwriting. Rather than relying on generic assumptions such as two percent annual rent growth or full occupancy, the investor can assign more realistic estimates based on comparable local performance and scenario testing.
Core Variables Investors Should Track
- Price trend data to understand whether the market is rising, stabilizing, or correcting.
- Rent growth and vacancy to evaluate income durability and leasing risk.
- Months of inventory and absorption to assess supply-demand balance.
- Financing conditions including mortgage rates and refinancing assumptions.
- Affordability indicators to estimate pressure on ownership demand and spillover to rentals.
- Population and employment growth to gauge long-term demand support.
- New construction pipeline to identify future competition and supply pressure.
- Exit liquidity metrics such as days on market and transaction velocity.
These variables become more powerful when viewed together rather than in isolation. A market with modest price growth may still be attractive if rents are rising, vacancy is tight, and inventory is limited. Conversely, a market with recent price momentum may prove weaker if affordability is stretched, supply is accelerating, and financing conditions are worsening. Predictive analytics is valuable precisely because it helps investors understand these interactions.

From National Headlines to Neighbourhood-Level Opportunity
One of the most important strategic lessons for investors is that national averages are rarely enough. They are useful for orientation, but they are often too broad to guide capital allocation. CMHC’s 2026 outlook makes this clear by showing that Ontario and British Columbia are expected to remain weaker than their 10 year averages, while the Prairies and Quebec are expected to remain above historical averages. For investors, this is more than a macro observation. It is a directive to segment aggressively.
A metro-level model is generally more valuable than a national one, and a submarket-level model is often more useful than a metro average. Consider two neighbourhoods within the same city. One may have a heavy condo development pipeline, soft investor demand, and rising listing supply. Another may have limited new construction, stronger rental demand, and better transit-linked employment access. A national statistic cannot capture that divergence. A neighbourhood-level predictive approach can.
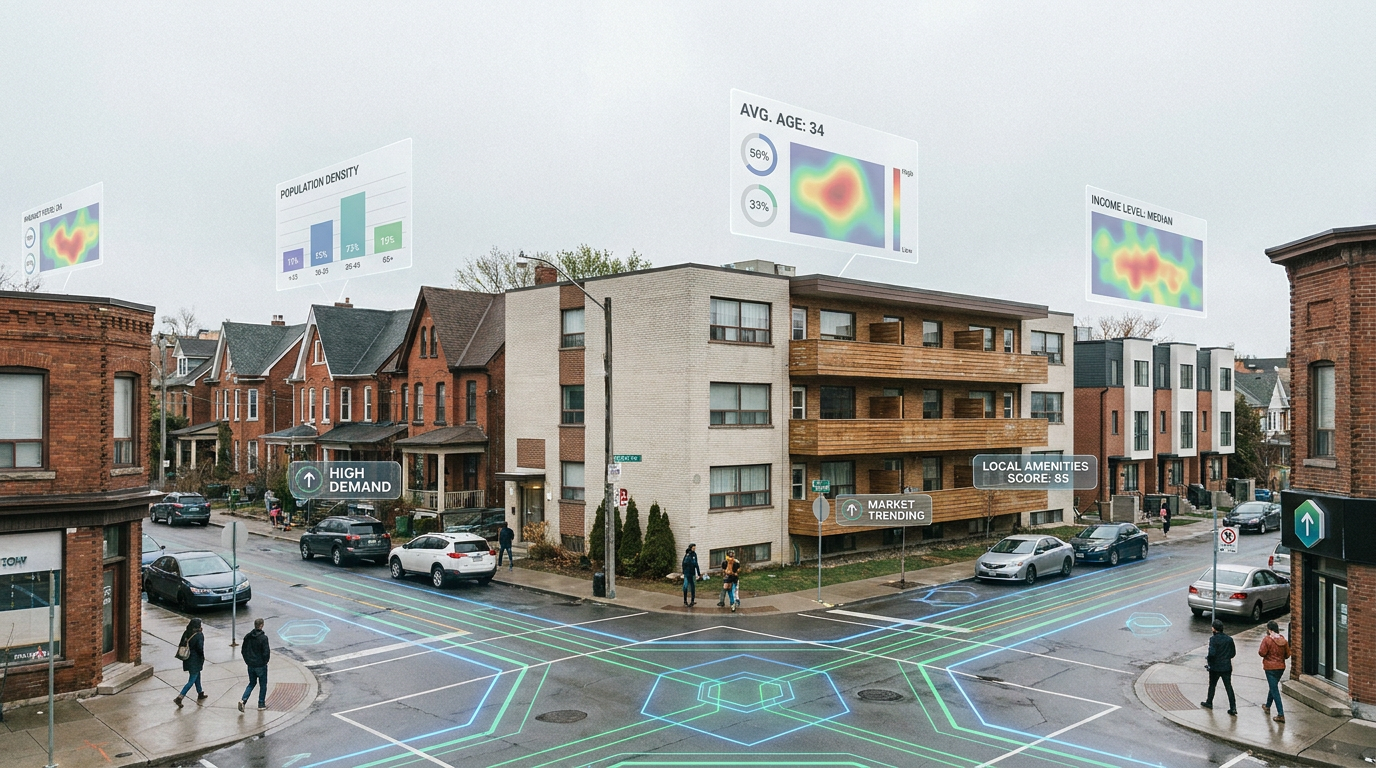
Geospatial analysis is particularly helpful here. Investors can layer location data with transit access, school quality, employment nodes, redevelopment activity, walkability, household formation, and historical rent performance. This does not only help identify attractive areas. It also helps avoid locations where headline affordability appears compelling but demand quality is weaker, supply risk is higher, or long-term liquidity is less reliable.
In practical acquisition work, this means every promising market should be broken into smaller segments. The question is not simply whether Calgary, Montreal, or Halifax looks attractive in aggregate. The better question is which districts within those cities are benefiting from the strongest alignment of rent resilience, demographic support, constrained supply, and acquisition pricing that still offers a reasonable margin of safety. That is where predictive analytics shifts from theory to edge.
How Investors Actually Use Predictive Analytics
The most practical use cases for predictive analytics are not abstract. They are directly tied to the decisions that determine return. The first is acquisition screening. Investors can rank opportunities by projected total return, downside resilience, and sensitivity to changing assumptions. This allows weaker deals to be filtered out early and stronger ones to receive deeper due diligence.
The second use case is rental underwriting. Rather than assuming market rent from a handful of current listings, investors can estimate future achievable rent based on local lease velocity, unit type, neighbourhood demand, and supply pressure. This is especially important in markets where a wave of new rental or condo inventory may affect tenant competition over the next twelve to twenty four months.
The third use case is rent optimization and asset management. Once a property is acquired, predictive data can support decisions on renovation timing, lease structuring, tenant retention strategy, and expense planning. Investors who understand likely turnover windows, local demand seasonality, and competing product can make better operating decisions and protect net income more effectively.
The fourth use case is timing refinances and dispositions. Predictive analytics can help estimate whether improving rents, tightening inventory, or declining financing pressure may create a better refinancing window. It can also highlight when upside has largely been realized and when exit liquidity may still be strong enough to justify a sale. This is especially relevant in an environment where cap rate expansion or refinancing friction can materially change returns.
What a Practical Predictive Workflow Looks Like
- Start with macro context using CMHC outlooks, CREA releases, affordability data, and broad economic indicators.
- Segment by region, focusing on metros and provinces with stronger relative fundamentals.
- Drill down into neighbourhood data such as inventory, supply pipeline, rent growth, vacancy, and employment access.
- Build asset-level assumptions around income, expenses, financing, and probable exit value.
- Run scenario analysis for base, upside, and downside cases.
- Compare projected returns on both nominal and risk-adjusted bases.
- Overlay human judgment, local broker intelligence, and negotiation factors before making the final decision.
This workflow reflects an important truth. Predictive analytics is not a substitute for market knowledge. It is a decision-support system that allows investors to use market knowledge more effectively. Strong operators combine hard data with on-the-ground intelligence such as tenant quality trends, street-by-street desirability, zoning signals, and broker sentiment. The result is not mechanical investing. It is more disciplined investing.
Scenario Analysis and Stress Testing
If there is one area where predictive analytics delivers immediate value, it is scenario analysis. Investors often make the mistake of underwriting to a single version of the future. They choose one rent growth assumption, one exit cap rate, one refinancing rate, and one occupancy expectation, then evaluate the deal as if that path is likely to unfold exactly as planned. In reality, investment success depends on how the asset performs across several plausible outcomes.
A good predictive model therefore includes a base case, an upside case, and a downside case. In the base case, rents may grow modestly, financing remains stable, and vacancy stays near historical norms. In the upside case, supply tightens more quickly, rental demand outperforms, and exit liquidity improves. In the downside case, borrowing costs stay elevated for longer, absorption slows, and rents flatten while expenses rise. These scenarios allow investors to ask a more sophisticated question than whether the deal works. They ask under what conditions it works, how much margin of safety exists, and how painful the downside could be.
This is particularly relevant in Canada’s current environment. With housing starts expected to decline through 2028, supply may tighten in some markets over time. Yet demand remains uneven, and financing costs continue to influence affordability and investor appetite. A scenario-based model helps investors avoid simplistic narratives. A future shortage of new supply does not automatically mean all current acquisitions are attractive. The timing, location, debt structure, and income profile still matter.
Stress testing should also include operational variables. Investors often model only revenue pressure, but expense volatility can be just as important. Insurance costs, property taxes, utilities, maintenance, and turnover costs can all erode performance. A predictive framework that tests both revenue and expense variability offers a much more realistic view of total return and debt service coverage.
The best investors do not look for certainty. They look for asymmetry, where the upside is attractive and the downside is manageable.
Common Misconceptions That Distort Investment Decisions
One of the most persistent misconceptions is that predictive analytics can forecast exact future prices. It cannot. Real estate markets are affected by policy changes, interest-rate shifts, behavioural swings, local supply shocks, and macroeconomic disruptions that no model can fully control. What predictive analytics offers is a more structured estimate of probabilities and ranges. Investors who understand that distinction are less likely to overstate confidence or underprice risk.
Another misconception is that more data automatically leads to better forecasting. In practice, bad data, inconsistent definitions, stale comparables, and poor feature selection can produce deeply misleading outputs. A complex model built on weak inputs is often worse than a simple model built on strong, relevant information. Investors should prioritize data quality, local relevance, and clear assumptions over technical complexity.
A third misconception is that appreciation is the only outcome worth modeling. Statistics Canada’s finding that prices rose much faster than rents over the 2011 to 2021 period is a reminder that valuation and income do not always move together. If income lags value for too long, leverage becomes more sensitive and total return becomes harder to defend. Investors should model total return, including cash flow, rent growth, financing costs, taxes, and exit assumptions, rather than treating price appreciation as the only source of success.
Finally, many investors assume predictive analytics replaces human judgment. In reality, it works best when paired with local insight, disciplined due diligence, and strong negotiation. A model may identify a statistically promising neighbourhood, but only experienced market work will reveal whether the subject property has hidden maintenance risk, weaker tenant demand on its specific block, or seller motivation that changes the negotiation dynamic. Data should inform judgment, not replace it.
Building a Smarter Investment Strategy
For investors looking to improve results, the strategic value of predictive analytics lies in portfolio construction as much as individual deal selection. Better forecasting allows capital to be allocated across regions, asset classes, and hold periods with more intention. Instead of concentrating exposure in one familiar market, an investor can evaluate whether diversification into a metro with stronger affordability, better rent momentum, or lower supply pressure may improve risk-adjusted return.
This is particularly relevant in a regionally segmented Canadian market. If Ontario and British Columbia are expected to remain weaker relative to their long-term averages while the Prairies and Quebec remain above theirs, that information should shape portfolio weighting. It does not mean the former markets should be ignored, nor that the latter should be bought indiscriminately. It means investors should compare opportunities through a structured lens that accounts for timing, cash-flow strength, and exit liquidity rather than defaulting to familiar urban narratives.
Investors should also think in terms of decision sequences. Predictive analytics can help determine not only what to buy, but when to renovate, when to refinance, when to increase reserves, and when to sell. In a market where modest price gains may follow a prior decline, execution timing can meaningfully influence realized return. The investor who can identify a stable income stream and an improving future supply-demand setup may accept a lower near-term appreciation profile because the risk-adjusted path is more attractive.
The broader implication is clear. Predictive analytics is no longer just a niche advantage used by large institutions or technology-heavy brokerages. As public data improves and more investors adopt structured underwriting tools, it is becoming part of baseline investment competence. Those who ignore it may still succeed through experience and market intuition, but they will increasingly be competing against participants who can quantify trends faster, compare risk more clearly, and move with greater confidence.
Conclusion: Better Data, Better Questions, Better Outcomes
Predictive analytics is best understood not as a promise of certainty, but as a disciplined framework for making better real estate decisions. In a market shaped by uneven regional performance, tighter affordability, higher financing sensitivity, and shifting supply conditions, that framework matters. It helps investors move beyond generic price narratives and focus instead on the combination of income durability, valuation discipline, liquidity, and timing that ultimately drives return.
The most effective real estate investors in Canada will be the ones who combine three things well. First, they will use high-quality macro and market data from sources such as CMHC, CREA, Statistics Canada, and North American affordability indicators. Second, they will narrow that information to metro, neighbourhood, and asset-level analysis that reflects how real submarkets behave. Third, they will pair analytics with judgment, local knowledge, and disciplined negotiation.
That combination is powerful because it mirrors how successful investing actually works. The goal is not to know the future with precision. The goal is to underwrite intelligently, prepare for multiple outcomes, and allocate capital where the balance of evidence is strongest. In that sense, predictive analytics is not just a technical tool. It is a strategic advantage, and increasingly, a requirement for investors who want to operate with clarity in a more demanding market.
For those willing to adopt it, the reward is not simply better forecasting. It is better questions, sharper risk management, stronger underwriting, and a more resilient path to long-term real estate investment success.



No Comment! Be the first one.