



Construction has always been a high-risk industry, but the way risk is managed is changing quickly. Site safety is no longer limited to paper forms, post-incident reviews, and periodic inspections completed in isolation. Today, safety analytics gives contractors, project managers, and safety leaders a more precise way to understand where hazards are building, which crews face elevated exposure, and what actions are most likely to prevent harm before it happens.
Table Of Content
- Why safety analytics matters more on construction sites than in many other industries
- What safety analytics actually includes on a real construction project
- Leading and lagging indicators: the backbone of predictive site safety
- Real-world application number one: fall protection analytics
- Real-world application number two: equipment, telematics, and struck-by risk reduction
- Real-world application number three: weather, climate, and environmental exposure
- Near misses, observations, and inspections: the most underused safety intelligence on site
- Contractor risk scoring and prequalification in a data-driven environment
- Digital platforms, mobile apps, AI, and wearables: what is practical today
- How safety analytics should influence day-to-day site management
- Common misconceptions that weaken construction safety analytics
- Building a practical safety analytics program step by step
- The Canadian and North American context for safer construction decisions
- Conclusion: safer construction sites need better intelligence, not just more reporting
At its core, safety analytics in construction is the use of data, technology, and statistical methods to support safer decisions on active job sites. It combines signals from daily operations such as near misses, inspection results, training records, permits, equipment telematics, weather conditions, and work-at-height exposure with outcome data such as injuries, lost-time incidents, and fatalities. The goal is not simply to collect more information. The goal is to make hazards visible early enough that site leaders can intervene while prevention is still possible.
That shift matters because construction remains one of the most dangerous sectors in North America. The National Institute for Occupational Safety and Health has long treated construction as a priority area because the work environment changes constantly, crews and subcontractors rotate, and common hazards such as falls, struck-by incidents, trench collapses, and heavy equipment interactions can escalate rapidly. In that environment, a reactive safety model is too slow. By the time injury statistics show a problem, workers may already have been exposed for weeks or months.
Real-world safety analytics changes the conversation from What happened? to What is likely to happen next if we do nothing? That is why the most effective construction firms now use dashboards, mobile reporting tools, AI-supported monitoring, and structured safety management systems as a decision layer around field operations. Analytics does not replace competent supervision, training, engineering controls, or accountability. It strengthens them by helping teams direct attention where it is needed most.
This article explores how safety analytics works in practical construction settings, which data matters most, how companies can turn raw reports into preventive action, and why a safer work environment increasingly depends on disciplined use of both leading and lagging indicators. The most important point is simple: when data is connected to field action, safety becomes faster, smarter, and more consistent.
Why safety analytics matters more on construction sites than in many other industries
Construction sites are uniquely dynamic. The layout changes as the project progresses, new trades enter and leave, temporary structures appear and disappear, and the interaction between people, equipment, materials, and weather is rarely static. A process that felt controlled last week can become dangerous this week because a scaffold was modified, a trench deepened, a delivery route shifted, or temperatures climbed sharply. Traditional safety systems are essential, but without a strong data layer they can miss emerging patterns until after an incident occurs.
The strongest argument for safety analytics is that it improves hazard prioritization. Safety teams have limited time and resources, and not every risk can be treated with the same urgency. Data helps separate routine variation from genuinely dangerous trends. If one subcontractor has repeated ladder noncompliance, if one area of the site generates a high number of near misses, or if weather conditions are increasing heat stress exposure for concrete crews, analytics can identify those signals early and support targeted intervention.
Falls are the clearest example. OSHA reported that falls were the leading cause of death in U.S. construction in 2024, with 389 fatal falls out of 1,034 construction fatalities. That statistic alone shows why fall protection analytics deserves a central role in site management. If a contractor tracks scaffold inspections, ladder incidents, work-at-height permits, harness compliance, and repeated deviations in elevated work zones, the safety program becomes much more proactive. Instead of waiting for a serious event, site leaders can tighten controls based on trend data.
There is also evidence that focused prevention and enforcement can reduce severe outcomes. OSHA noted that federal fatal fall investigations dropped from 234 to 189 in fiscal year 2024. One year of data does not solve the problem, but it strongly suggests that attention directed toward a known hazard can move results. Safety analytics helps create that focus consistently rather than occasionally, which is exactly what active construction environments require.
Safety analytics is most valuable when it turns familiar hazards into measurable priorities. In construction, the biggest gains often come from seeing recurring exposure patterns before they become injuries.
What safety analytics actually includes on a real construction project
Some people hear the word analytics and imagine a complex platform reserved for large national contractors. In practice, the concept is broader and more accessible than that. Safety analytics can begin with simple digital inspection forms, structured near-miss reporting, and weekly dashboard reviews. What makes it analytical is not the size of the software budget. What matters is whether information from the field is collected consistently, reviewed intelligently, and linked to clear action.
Most mature safety analytics programs combine several kinds of data. These data sources often include incident logs, inspection findings, permit-to-work records, worker orientation and training status, equipment GPS and telematics, shift schedules, environmental conditions, contractor compliance history, and quality of corrective action closure. Some firms also use wearables, geofencing, silica monitoring tools, or computer vision systems that can identify missing PPE or unsafe zone entry. The more important point, however, is that each source contributes a different view of risk.
Leading indicators are especially important because they reveal exposure before injury occurs. Near misses, safety observations, overdue corrective actions, incomplete training, repeated failed inspections, and frequent high-risk permits all qualify as leading indicators. These are the signals that tell a manager where the next incident may happen. They are imperfect on their own, but when reviewed together they can expose a pattern that would otherwise stay hidden.
Lagging indicators still matter as well. Recordable injuries, lost-time incidents, restricted work cases, property damage, and fatalities remain critical measures because they show where controls failed. The mistake is relying on them alone. If a company waits for injury data to reveal risk, it is measuring the problem after workers have already paid the price. Strong programs use lagging indicators for accountability and learning, then use leading indicators to guide prevention in real time.
Leading and lagging indicators: the backbone of predictive site safety
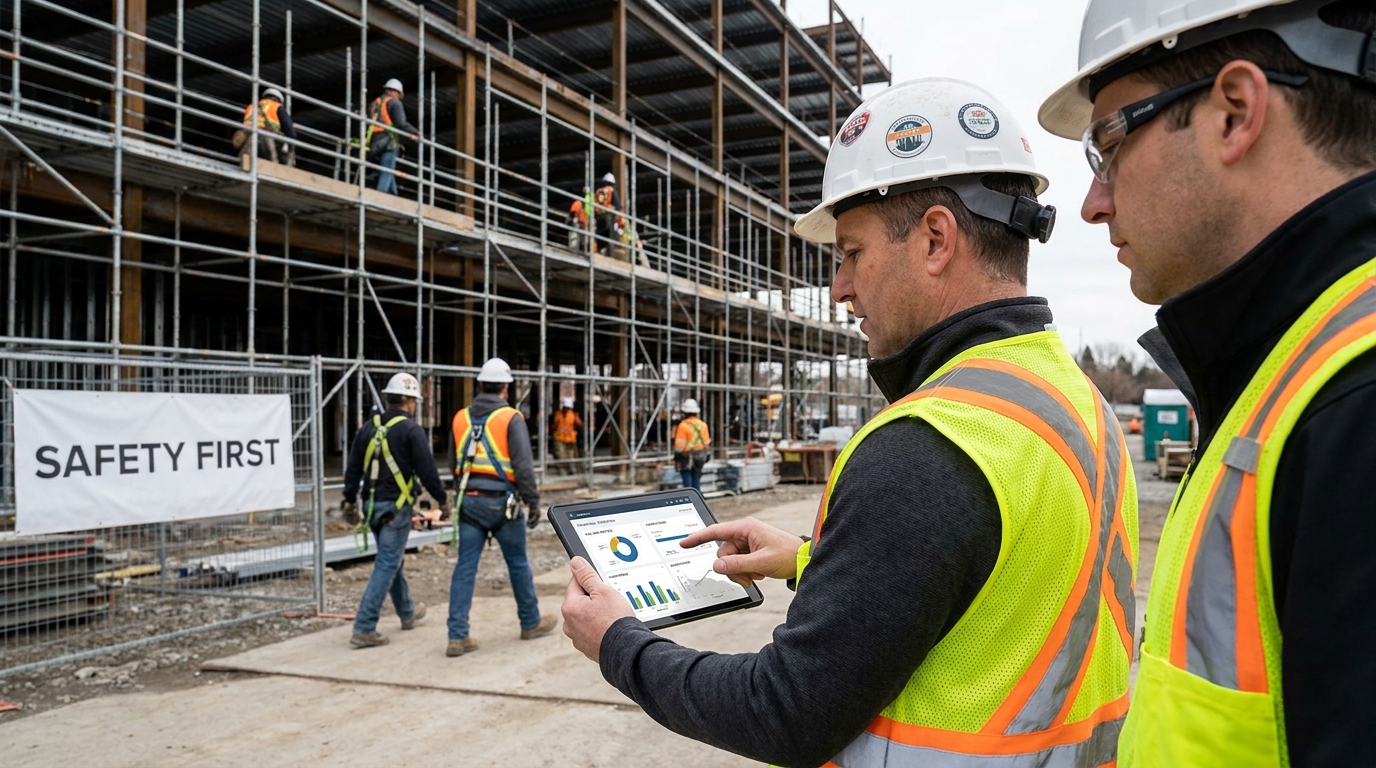
Understanding the difference between leading and lagging indicators is one of the most important steps in building a useful construction safety dashboard. Lagging indicators are easy to recognize because they describe completed events. They include injuries, claims, citations, lost-time rates, and fatalities. They are concrete and often required for reporting, which is why many organizations rely on them heavily. The problem is that they tell you where the damage already happened.
Leading indicators are more operational. They track the conditions and behaviors that shape risk before a serious outcome emerges. On a construction site, this might include unclosed inspection deficiencies, frequency of toolbox talks, delayed permit approvals, high overtime hours, missed equipment checks, recurring trench access issues, and spikes in near-miss submissions tied to a specific task. These signals can indicate that workload, supervision, sequencing, or controls are drifting out of a safe range.
The value of analytics comes from connecting the two. If a team sees that a rise in work-at-height permits is consistently followed by more near misses on ladder use, that relationship is actionable. If overtime and weather heat index together correlate with more slips or procedural lapses, that is also actionable. Over time, construction firms can identify their own project-specific risk combinations rather than relying only on generic assumptions.
This approach fits naturally with established safety concepts in Canada and the United States. Hazard identification, job safety analysis, and formal safety management systems all depend on recognizing exposure early. Analytics does not replace those systems. It strengthens them by introducing a disciplined method for comparing data across crews, locations, subcontractors, and project phases. It transforms scattered observations into a pattern that site leaders can respond to with speed and confidence.
Real-world application number one: fall protection analytics
Because falls remain the most serious recurring hazard in construction, fall protection is often the first area where analytics delivers measurable value. The strongest programs do not only record whether a fall incident occurred. They measure the operational environment around elevated work. That means tracking scaffold inspection completion, frequency of ladder use, missing guardrail observations, work-at-height permit volume, harness training status, and repeated corrective actions that stay open too long.
In practical terms, a site manager might review weekly data and notice that one crew has a disproportionate number of observations related to ladder setup. Another project zone might show repeated late scaffold tags or increased access to incomplete edges during concrete work. These are not abstract insights. They immediately point to interventions such as changing access routes, reinforcing setup standards during toolbox talks, increasing supervisor presence, or adjusting sequencing so work at height is less congested.
Analytics also helps distinguish between widespread site issues and localized trade-specific problems. If multiple subcontractors are showing elevated fall-related observations in one area, the issue may be layout, congestion, or planning. If one subcontractor has repeated noncompliance across areas, prequalification, supervision, or training may be the underlying problem. This is where dashboards become powerful. They move the safety conversation away from vague impressions and toward evidence-based decision making.
Most importantly, fall analytics supports a culture where near misses and minor deviations are treated as meaningful signals, not administrative noise. A missing anchor point that gets corrected before work begins should still be visible in the data. So should a recurring tendency to improvise access equipment. Prevention improves when the site learns from weak signals rather than waiting for a strong and irreversible one.
Real-world application number two: equipment, telematics, and struck-by risk reduction
Heavy equipment is another area where safety analytics can make a substantial difference. Construction projects depend on excavators, loaders, dump trucks, cranes, and telehandlers, but the interaction between machines and workers creates persistent struck-by and caught-between risk. Traditional controls such as spotters, exclusion zones, pre-use checks, and traffic plans remain essential. Analytics strengthens them by showing when and where those controls are under stress.
Telematics data from equipment can reveal patterns that matter for safety, not just maintenance or productivity. Speed in active work zones, harsh braking, repeated reversing in congested areas, unauthorized use windows, idle time in unsafe locations, and route deviations can all indicate elevated exposure. When this information is combined with incident reports, observation data, and work schedules, it becomes possible to identify risk concentrations that would not be obvious from a single event report.
For example, a contractor might find that near misses involving pedestrians increase during early morning deliveries when visibility is lower and staging space is compressed. Another site may discover that one access road generates repeated reversing conflicts between dump trucks and smaller service vehicles. These findings can lead to direct changes such as staggered delivery times, revised traffic separation, improved spotter procedures, or new barriers between foot traffic and plant movement.
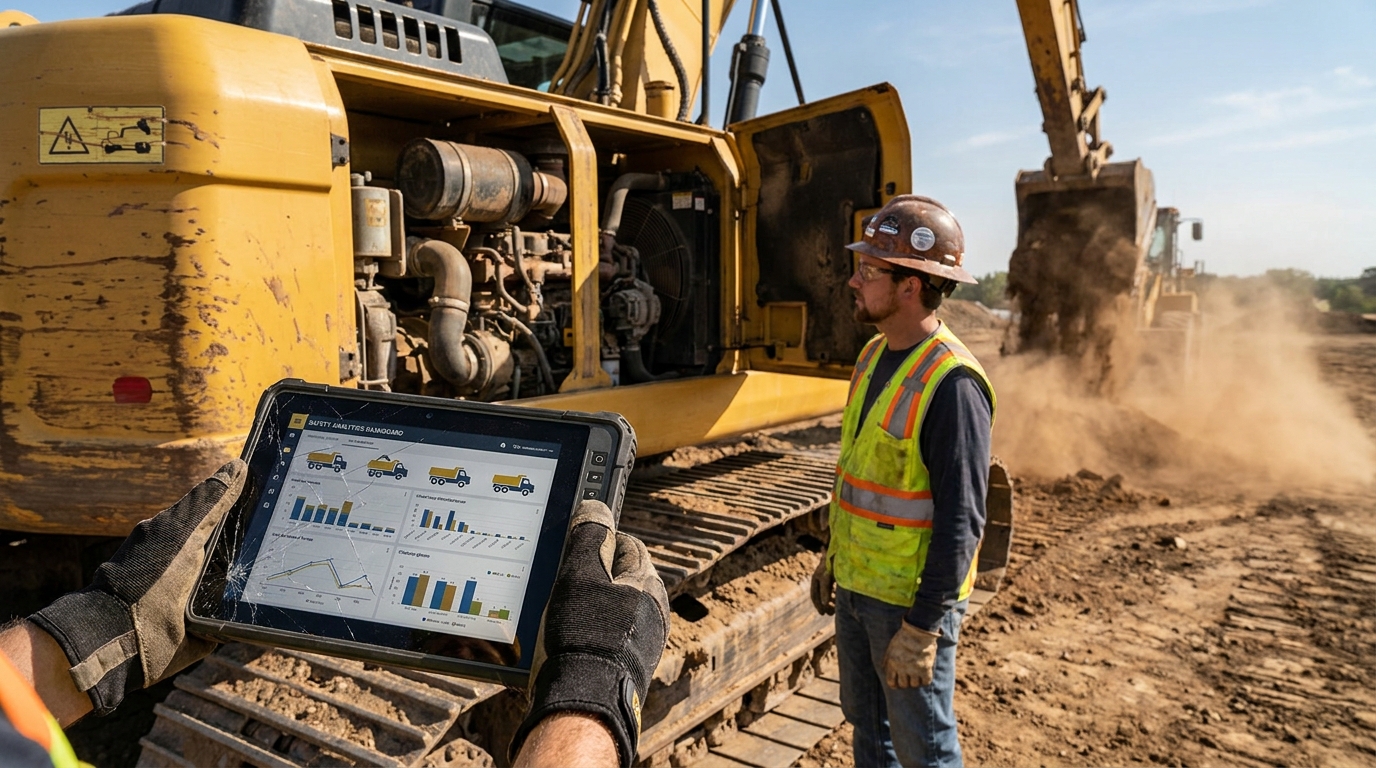
Analytics is especially useful here because equipment exposure can be continuous and normalized by crews over time. Workers may adapt to congestion and begin treating it as routine. Data can interrupt that normalization by documenting how often risky interactions occur and whether control measures are actually reducing them. In this way, safety analytics acts as a reality check on everyday operations.
Real-world application number three: weather, climate, and environmental exposure
Construction safety is increasingly shaped by climate and environmental conditions. Heat stress, cold exposure, high winds, heavy rain, lightning, poor air quality, and wildfire smoke all affect both physical risk and human performance. These factors also influence schedule pressure, fatigue, visibility, hydration, and decision quality. As weather becomes less predictable in many regions, integrating environmental data into safety management is no longer optional for advanced projects.
Safety analytics makes environmental exposure measurable. Instead of relying only on general weather forecasts, projects can connect local temperature, heat index, wind thresholds, smoke advisories, and precipitation alerts to task-specific exposure. That matters because a framing crew on an elevated deck, a concrete team in reflective heat, and an excavation crew in wet trench conditions are not facing the same level of risk even if they are on the same project site.
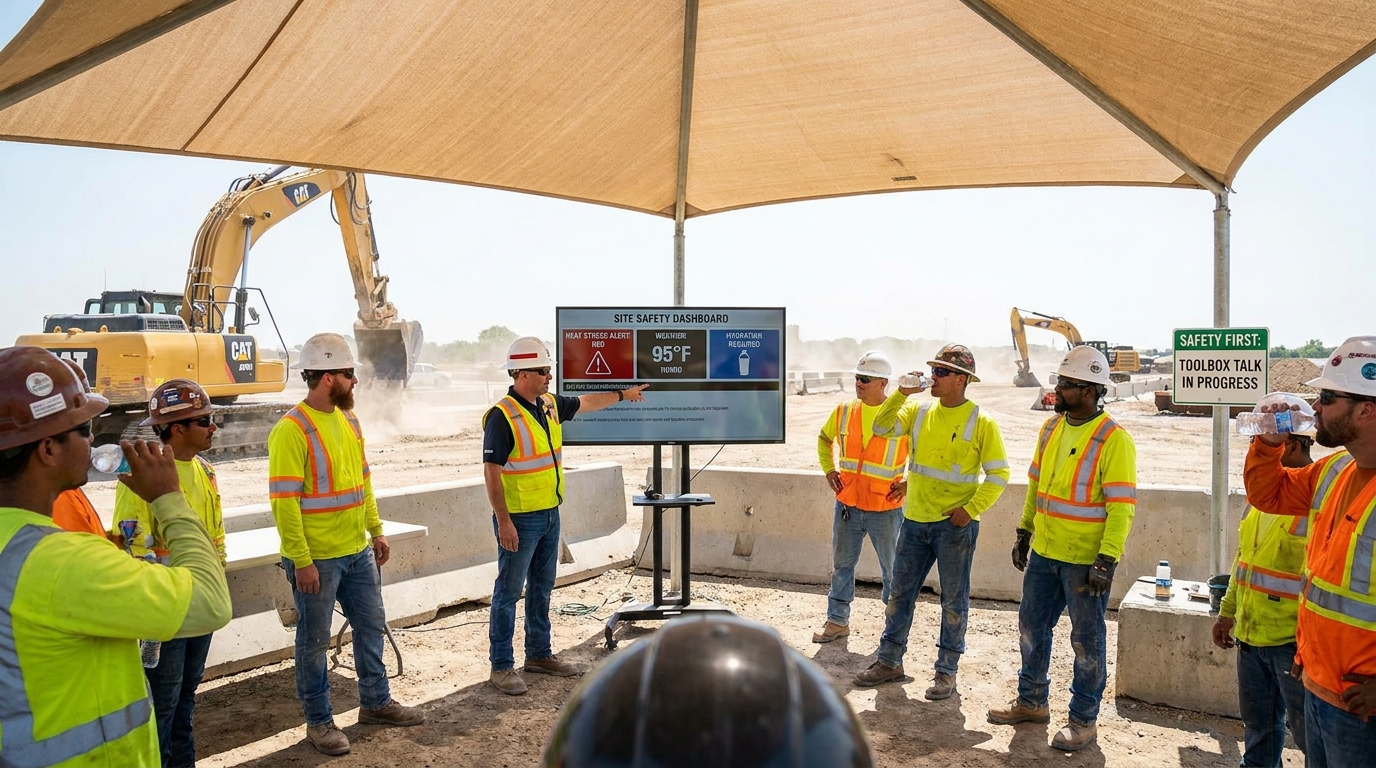
With a structured dashboard, managers can identify when heat-related near misses rise during certain hours, when high winds coincide with increased crane-related restrictions, or when wet conditions lead to more slip hazards along access routes. The next step is operational. Break schedules can change, water stations can be added, physically demanding tasks can be rescheduled, respiratory protection rules can tighten, and supervisors can increase checks in the highest-risk periods.
This kind of planning directly supports a safer work environment because it respects the fact that conditions shape behavior. A worker dealing with heat stress, dehydration, or smoke irritation is more vulnerable to error even if formal procedures remain unchanged. Analytics helps management see environmental risk as a live operational variable rather than a background inconvenience.
Near misses, observations, and inspections: the most underused safety intelligence on site
One of the clearest misconceptions in construction safety is that only serious incidents produce useful data. In reality, near misses, field observations, and inspection findings often contain the richest preventive insight. They describe the small failures, interrupted sequences, and weak controls that happen far more frequently than recordable injuries. If these signals are captured consistently, they create an early warning system for the project.
However, more data is not automatically better. Poor reporting culture can distort analytics badly. If crews only report near misses after management pressure, if definitions vary across subcontractors, or if observations are written so vaguely that no one can classify them, the dashboard may create false confidence. Good safety analytics depends on disciplined reporting standards, clear categories, and a culture where people believe reporting leads to useful action rather than blame.
Inspection quality matters for the same reason. A checklist completed mechanically is not the same as a real hazard review. The strongest digital inspection programs include structured fields, photo evidence, location tagging, severity ranking, and deadlines for closure. This makes it possible to analyze not just how many issues were found, but which hazards repeat, how quickly they are corrected, which crews are affected, and whether certain deficiencies consistently return after closeout.
When near misses, observations, and inspections are treated as strategic inputs rather than compliance paperwork, site management becomes sharper. Supervisors can adjust task planning, safety professionals can direct audits toward recurring themes, and project leaders can see whether the same problem is local, trade-specific, or systemic. That is where prevention starts to feel less reactive and more engineered.
Contractor risk scoring and prequalification in a data-driven environment
Construction projects often depend on multiple subcontractors, and risk rarely distributes evenly across them. Some firms have stronger supervision, better training discipline, and more mature safety systems than others. Safety analytics can help general contractors and owners evaluate this variation more objectively through contractor-level risk scoring. This does not mean reducing a company to a single number. It means combining multiple indicators into a clearer profile of how each contractor performs under real project conditions.
Inputs might include training completion rates, inspection performance, responsiveness to corrective actions, permit compliance, quality of near-miss reporting, prior incident history, and recurring hazard categories. A contractor with low injury counts but repeated unclosed deficiencies and weak reporting may still represent elevated risk. Another contractor with transparent reporting and fast corrective action closure may actually be safer even if it appears to generate more observations on paper.
This is one reason mature organizations increasingly value structured systems such as COR and ISO-aligned safety management processes. In Canada, COR is recognized nationally as an accreditation approach for occupational health and safety management and may be required in some construction and energy settings. Beyond certification itself, these systems create the consistency that analytics needs. Standard terminology, documented procedures, and repeatable audits make cross-project comparisons more reliable.
Used properly, contractor analytics improves both prequalification and live project controls. It helps owners and builders ask better questions before work begins, then verify in the field whether promised safety performance actually appears during execution. This can lead to smarter onboarding, more focused oversight, and stronger accountability without relying only on headline incident rates.
Digital platforms, mobile apps, AI, and wearables: what is practical today
Much of the momentum behind construction safety analytics comes from improvements in field technology. Mobile inspection apps make it easier to capture observations in real time. Digital permit systems create searchable records of high-risk work. Dashboards allow project managers to compare trends across crews and phases. AI-supported monitoring can flag PPE gaps, unsafe zone entry, or unusual movement patterns. Wearables can support alerts related to falls, fatigue, or worker location in restricted zones.
These tools are increasingly practical, but their value depends on implementation discipline. A flashy platform will not improve safety if field teams see it as extra admin work disconnected from operations. Successful deployment usually starts with a small set of clear use cases. For example, a company may digitize daily inspections first, then add permit analytics, then layer in telematics or environmental alerts. The process works best when technology solves a visible field problem rather than being adopted for its own sake.
AI deserves special attention because expectations can become unrealistic. Computer vision and automated alerts are promising, especially for identifying PPE compliance, line-of-fire exposure, and restricted zone entry. But these systems are not a substitute for site leadership. They work best as a support mechanism that helps teams detect patterns faster, verify compliance trends, and focus human attention where conditions are changing quickly.
Smaller contractors should not assume this space belongs only to large enterprise firms. Even a modest digital stack can improve outcomes. A mobile app for inspections, a shared dashboard for corrective actions, and a structured near-miss log can create meaningful visibility on smaller projects. What matters most is consistency, not complexity.
How safety analytics should influence day-to-day site management
The biggest test of any analytics program is whether it changes field decisions. If dashboards stay in the office and never affect sequencing, supervision, inspections, or worker communication, they are not improving safety. The best programs translate data into routine management actions. That might mean increasing inspections in one high-risk zone, adjusting work sequencing after repeated congestion reports, revising a traffic plan based on telematics, or changing toolbox talk topics after a cluster of similar near misses.
Job Safety Analysis and Task Hazard Analysis processes become much stronger when supported by current site data. Rather than discussing generic risks, crews can talk about the hazards actually trending on their project that week. That creates more credibility and better engagement because workers see the direct connection between what they reported and what management is doing about it. The internal responsibility model depends on that kind of feedback loop.
Supervision also becomes more effective when analytics highlights where attention is thin. If one crew has strong production pressure, high overtime, and repeated low-severity observations, a supervisor can increase presence before those conditions evolve into something more serious. Similarly, if one project phase has elevated permit activity and multiple subcontractor interfaces, management can allocate more safety support during that window rather than spreading attention evenly across the whole site.
In short, analytics should influence the rhythm of the site. It should shape morning planning, toolbox talks, inspection priorities, contractor reviews, and management walkdowns. When data reaches that level of operational use, it stops being a reporting function and becomes part of site control.
Common misconceptions that weaken construction safety analytics
The first misconception is that analytics replaces field judgment. It does not. A dashboard can identify trends, but it cannot physically install guardrails, coach a crew, stop unsafe work, or redesign an access route. Human leadership remains the deciding factor. Analytics simply helps leaders know where to focus and what to verify.
The second misconception is that more data automatically creates better safety decisions. In reality, low-quality or inconsistent data can be worse than limited data because it creates the illusion of precision. If underreporting is common, if categories are inconsistent, or if corrective actions are closed without real verification, the system may point managers away from the actual problem. Data quality, standard definitions, and honest reporting are non-negotiable.
The third misconception is that safety analytics is only useful after a company reaches a certain size. That is not true. Smaller contractors can benefit immediately from basic digital inspection records, incident tracking, and weekly review of recurring hazards. The analytics may be simpler, but the preventive value is still real. In fact, smaller firms often gain faster because they can change field practice quickly once a pattern becomes visible.
The fourth misconception is that analytics can solve structural hazards by itself. It cannot. If trench protection is inadequate, if lockout procedures are weak, or if silica controls are missing, no dashboard will compensate for absent physical controls. Analytics is a decision-support layer, not a substitute for the hierarchy of controls, training, supervision, or enforcement.
Building a practical safety analytics program step by step
For firms that want to improve construction site safety through analytics, the best starting point is not a massive data project. It is a simple and disciplined framework. First, define which hazards matter most on your work. For many projects, falls, mobile equipment interactions, excavation, electrical exposure, and environmental stress will be the core categories. Then identify the leading indicators that best reflect those exposures.
Second, standardize reporting. Crews, supervisors, and subcontractors need common definitions for near misses, observations, inspection findings, and corrective action severity. If the input language changes from team to team, the output will be unreliable. This step often matters more than software selection because analytics can only be as trustworthy as the data discipline behind it.
Third, review data at a cadence that matches project speed. On active sites, monthly review is often too slow. Weekly reviews are more useful, and some high-risk signals should be checked daily. The purpose is not to admire charts. It is to identify where action is needed now. Corrective actions, focused inspections, revised task planning, and contractor conversations should follow directly from the review.
Fourth, connect analytics to accountability. If recurring issues appear in the same zone, crew, or subcontractor, someone should own the response and closure. Good systems track not only hazard identification but also whether interventions worked. Over time, this creates a learning loop where the company can compare which actions actually reduce exposure and which only create paperwork.
Finally, keep the system proportional to the organization. A sophisticated predictive model is not required on day one. What matters is starting with the hazards that cause the greatest harm and building a reliable feedback loop around them. In many cases, a well-run simple system outperforms a complex one that nobody trusts.
The Canadian and North American context for safer construction decisions
Safety analytics is gaining traction in part because the broader regulatory and industry environment already supports structured hazard management. In Canada, the Labour Program publishes annual occupational injury reporting for federally regulated employers using EAHOR submissions, and the 2024 report recorded 74 fatal injuries, up from 71 in 2023. While those figures are not limited to construction, they show how annual injury datasets are used to identify higher-risk industries and direct intervention.
Canadian safety practice also reflects a strong emphasis on systematic hazard recognition, internal responsibility, and management systems. Resources from organizations such as the Canadian Centre for Occupational Health and Safety support approaches that align naturally with analytics, including hazard identification, management systems, and practical sector tools. Construction-specific resources such as silica control tools and provincial compliance guidance show how data and decision support can be embedded into daily site work rather than treated as abstract policy.
In the United States, OSHA and NIOSH continue to emphasize construction as a high-risk sector, particularly around falls, struck-by incidents, and other severe hazards. The message from both countries is broadly consistent. Safe work depends on planning, hazard recognition, reliable controls, and accountability. Analytics strengthens each of these by making risk patterns easier to detect and harder to ignore.
Conclusion: safer construction sites need better intelligence, not just more reporting
Construction safety analytics is not about turning job sites into spreadsheets. It is about giving site leaders a clearer line of sight into the conditions that shape risk every day. When near misses, inspections, permit activity, equipment behavior, weather exposure, training status, and incident outcomes are reviewed together, managers can act earlier and more precisely. That leads to better sequencing, more focused supervision, stronger contractor oversight, and smarter prevention.
The most effective programs stay grounded in the field. They respect the reality that workers still need competent planning, engineering controls, supervision, and a culture that values speaking up. Analytics simply makes those fundamentals more targeted and measurable. It tells the team where to look, what to question, and which patterns should never be dismissed as routine.
For an industry where conditions change by the hour and hazards can escalate quickly, that intelligence layer is becoming essential. Falls, equipment interactions, environmental stress, and recurring unsafe conditions cannot be managed well through lagging data alone. A safer work environment depends on earlier signals, better interpretation, and visible follow-through.
In that sense, safety analytics is not just a technology trend in construction intelligence. It is a practical management upgrade. The companies that use it well are not replacing safety leadership. They are making it sharper, faster, and better informed. On modern construction sites, that may be one of the most important differences between a program that documents risk and one that actively reduces it.



No Comment! Be the first one.