



Construction has always depended on timing, coordination, and disciplined execution, but today the supply chain behind every project is under unusual strain. Builders are balancing volatile material prices, inconsistent lead times, labor shortages, fuel cost swings, and trade disruptions at the same time. Even well-run projects can struggle when steel arrives late, mechanical equipment is substituted at the last minute, or delivery windows no longer align with field production. In this environment, intuition alone is not enough. Data analytics gives construction teams a practical way to see risk earlier, make faster decisions, and improve outcomes across procurement, logistics, and project delivery.
Table Of Content
- Why construction supply chains are uniquely difficult to manage
- What supply chain analytics actually means in construction
- The business case for analytics in construction supply chains
- The core data sources that builders should connect
- Foundational systems that support analytics
- Practical use cases that deliver real value
- Material demand forecasting
- Lead-time risk detection
- Procurement spend analytics
- Inventory optimization
- Supplier performance scorecards
- How to build a construction supply chain dashboard that people actually use
- Implementation steps for companies of different sizes
- Common challenges and how to address them
- Advanced trends shaping the next generation of construction supply chain intelligence
- What success looks like in practice
- Conclusion: analytics as the intelligence layer behind better building
The need is especially clear in fragmented markets. Statistics Canada found that labour productivity in Canadian residential construction fell by a cumulative 37.3% from 2001 to 2023, which works out to roughly 2.1% per year on average. In 2023, firms with fewer than 20 workers accounted for 66.1% of employment in Canadian residential construction. Those figures matter because fragmentation makes it harder to standardize buying processes, coordinate suppliers, share inventory across sites, and learn systematically from past jobs. When each project behaves like its own separate ecosystem, waste becomes easier to hide and performance becomes harder to improve.
At the same time, external pressure has not eased. Statistics Canada reported in 2026 that construction businesses were still citing raw material costs, labor costs, and energy costs as major obstacles, with 61.8% naming raw materials as an obstacle over the next three months. Diesel prices in April 2026 were significantly higher year over year in multiple Canadian regions, including Ontario at +66.3% and the Prairie region at +63.6%, pushing transportation and equipment costs upward. Statistics Canada also noted that retaliatory tariffs between Canada and the United States disrupted supply chains and contributed to higher metal and steel product prices. These are not abstract market signals. They directly affect purchase timing, supplier selection, contingency planning, and the economics of every active project.
Still, analytics is often misunderstood in construction. Some teams assume it is only relevant to mega-projects with enterprise software and large data teams. Others assume more data automatically means better decisions. Both views miss the point. Good supply chain analytics is not about collecting everything. It is about structuring the right project, purchasing, inventory, vendor, and schedule data so that teams can act with more confidence. A small contractor can benefit from a simple lead-time tracker just as much as a national builder can benefit from predictive demand models. The value comes from clarity, consistency, and response speed.
This guide explains how modern builders can use data analytics to streamline the construction supply chain in practical terms. We will look at the signals worth tracking, the systems that support better decisions, the common implementation mistakes, and the metrics that actually matter in the field. The goal is not to describe analytics as a futuristic add-on. The goal is to show how it becomes the intelligence layer behind more reliable buying, better inventory decisions, stronger supplier relationships, and smoother project delivery.
Why construction supply chains are uniquely difficult to manage
Construction supply chains are more complex than those in many other industries because every project is temporary, location-specific, and vulnerable to design and schedule changes. A manufacturing plant may refine one repeatable process over time, but a builder coordinates different trades, different vendors, and different site constraints on nearly every job. Materials often arrive from multiple regions, long-lead components may depend on specialized fabrication capacity, and delivery timing must align with site readiness. If one input shifts, the effects ripple quickly through labor planning, equipment allocation, and cash flow.
Fragmentation adds another layer of difficulty. When a market is dominated by small firms, purchasing data may sit in disconnected spreadsheets, email threads, paper packing slips, and separate accounting systems. Item names vary, cost codes differ by project, and supplier performance is remembered informally rather than measured consistently. This makes it difficult to answer basic operational questions with confidence. Teams may not know which vendor is most reliable by category, which projects routinely over-order materials, or how often substitutions are causing downstream delays.
Supply-chain problems in construction are also rarely just procurement problems. Material delays might begin with a vendor issue, but they can also be driven by late design decisions, permitting shifts, transportation bottlenecks, field sequencing changes, or labor shortages that alter installation timing. World Bank research and case materials repeatedly identify delays in material supply, weak monitoring, and outdated costing data as drivers of project overruns and implementation delays. In other words, poor visibility across the project lifecycle can be just as damaging as an unreliable supplier.
This is why data analytics matters. It helps construction teams connect information that usually lives in separate places. Rather than looking at a purchase order in isolation, analytics links that order to the project schedule, vendor history, inventory levels, delivery risk, and expected installation date. Once those relationships are visible, managers can move from reactive firefighting to earlier intervention.
Important reality check: Data analytics does not eliminate supply-chain volatility. It improves visibility, forecasting, and response time, but external shocks such as tariffs, weather, labor shortages, and fuel spikes still matter. The advantage is not perfect control. The advantage is better preparation.
What supply chain analytics actually means in construction
Supply chain analytics in construction is the process of turning operational data into decisions that improve material flow, reduce waste, and protect project schedules. The data usually comes from estimating systems, ERP platforms, accounting software, procurement records, inventory logs, delivery confirmations, scheduling tools, field reports, and supplier communications. When those sources are standardized and connected, they can answer practical questions about cost, timing, risk, and performance. The most effective programs typically focus on six core capabilities: demand forecasting, lead-time analytics, procurement spend analytics, inventory optimization, supplier relationship management, and risk scenario planning. More advanced organizations may layer in digital twins, geospatial analytics, and AI-assisted planning, especially for infrastructure and road construction. Even before those advanced tools, however, there is substantial value in simply cleaning basic data and building consistent dashboards that the whole team can trust.
For example, a project team may want to know whether a quoted lead time for switchgear is realistic based on actual supplier performance over the last 18 months. A procurement leader may want to compare spend across concrete, drywall, and steel vendors by region and see which suppliers are most prone to late deliveries or incomplete shipments. A field superintendent may need visibility into whether material releases are aligned with revised sequence plans. Analytics supports each of these decisions by converting records into patterns.
It is also worth noting that digital tools do not replace field judgment. The best outcomes usually come from combining analytics with the expertise of superintendents, estimators, project managers, and procurement teams. The dashboard may identify a lead-time risk, but experienced staff often know whether a workaround is viable, whether staging space exists on-site, or whether sequence changes will create new problems. Analytics is strongest when it informs action rather than pretending to automate judgment away.
The business case for analytics in construction supply chains
When margins are tight, supply chain inefficiency can quietly erode project performance from several directions at once. Contractors may pay rush freight to recover from late orders, carry excess inventory because lead times feel uncertain, accept expensive substitutions to protect schedules, or suffer idle labor when materials do not arrive as planned. None of these costs always appear in one line item, which is why they are often underestimated. Analytics helps expose these hidden losses by tracking them across jobs and over time.
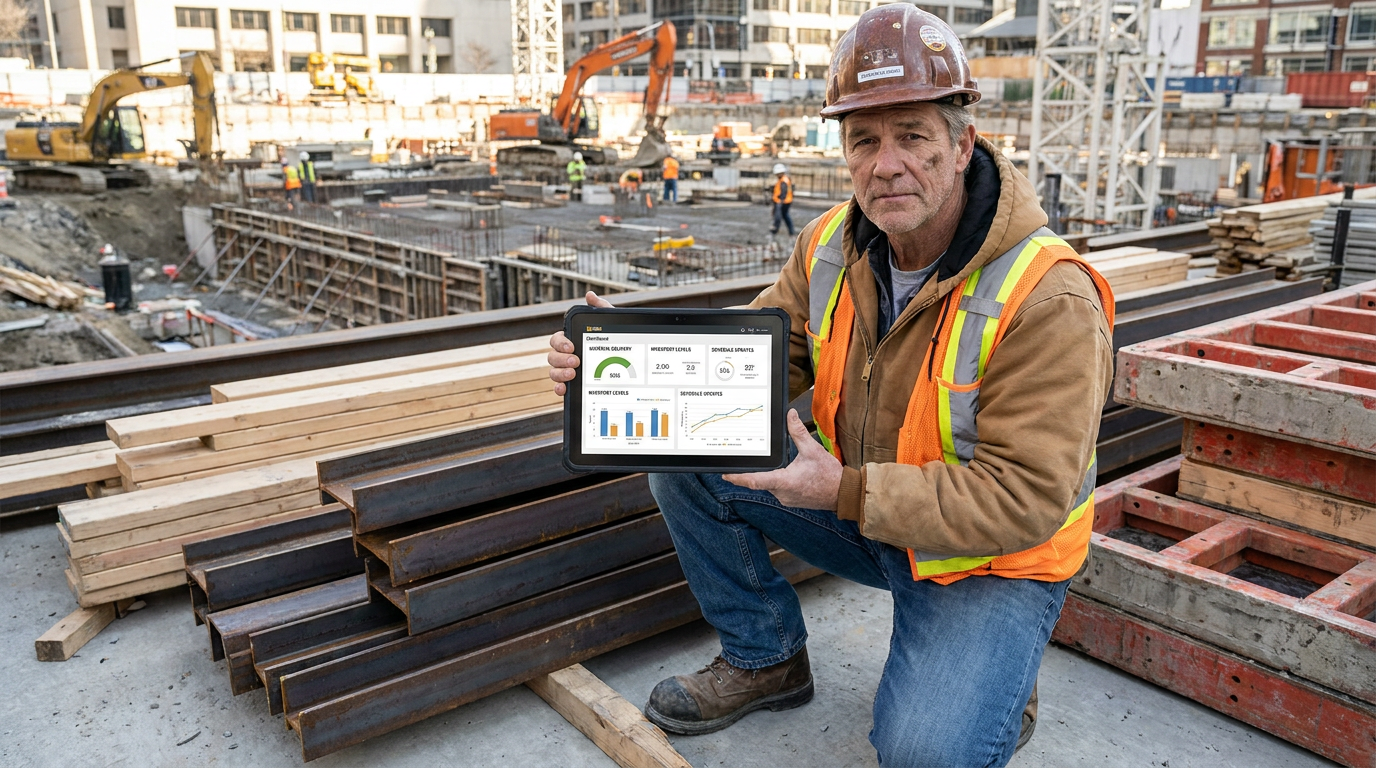
A strong analytics program usually improves decision-making in three ways. First, it increases visibility by showing what has been ordered, what is delayed, what is on-site, and what is at risk. Second, it improves forecasting by using historical patterns to estimate future demand, expected lead times, and likely budget pressure. Third, it supports accountability by measuring vendor performance, internal planning accuracy, and the impact of late changes. Together, these capabilities reduce avoidable surprises.
Consider the current Canadian context. Statistics Canada found that 90.4% of construction businesses reported supply-chain impacts in the second quarter of 2022, illustrating how exposed the sector is to upstream disruption. If nearly every business in a sector is feeling some form of supply chain pressure, then the competitive advantage shifts toward how quickly firms can detect problems and adapt. Analytics does not change the external market, but it changes how intelligently a company can operate within that market.
The return is not only financial. Better supply chain data can improve client communication, support more realistic scheduling, and reduce friction between the office and the field. It can also improve confidence at bid stage because estimators can reference current lead-time trends, supplier reliability, and cost escalation patterns rather than relying on assumptions that may already be outdated. In a volatile market, better information is not a luxury. It is part of operational resilience.
The core data sources that builders should connect
Many construction companies want better analytics but feel blocked by the idea that they need a perfect digital ecosystem before starting. In reality, the first step is usually simpler. Teams need to identify the data they already have, assess its quality, and connect the most useful sources. The goal is not immediate sophistication. The goal is to create a reliable operational baseline.
The most important source is often procurement data. Purchase orders, quote comparisons, committed costs, vendor terms, shipment confirmations, and invoice timing all reveal how materials actually move through the business. When this data is categorized consistently by material type, project, location, and supplier, it becomes possible to analyze spend concentration, timing risk, and variance between estimated and actual purchasing behavior.
Project schedule data is equally important because supply chain performance only matters in relation to field timing. A material can arrive on the promised date and still be functionally late if the installation sequence moved up or if predecessor work finished early. Linking procurement and schedule data allows teams to identify true critical items rather than treating all purchases as equal. That distinction is essential when staff time is limited and interventions need to be prioritized.
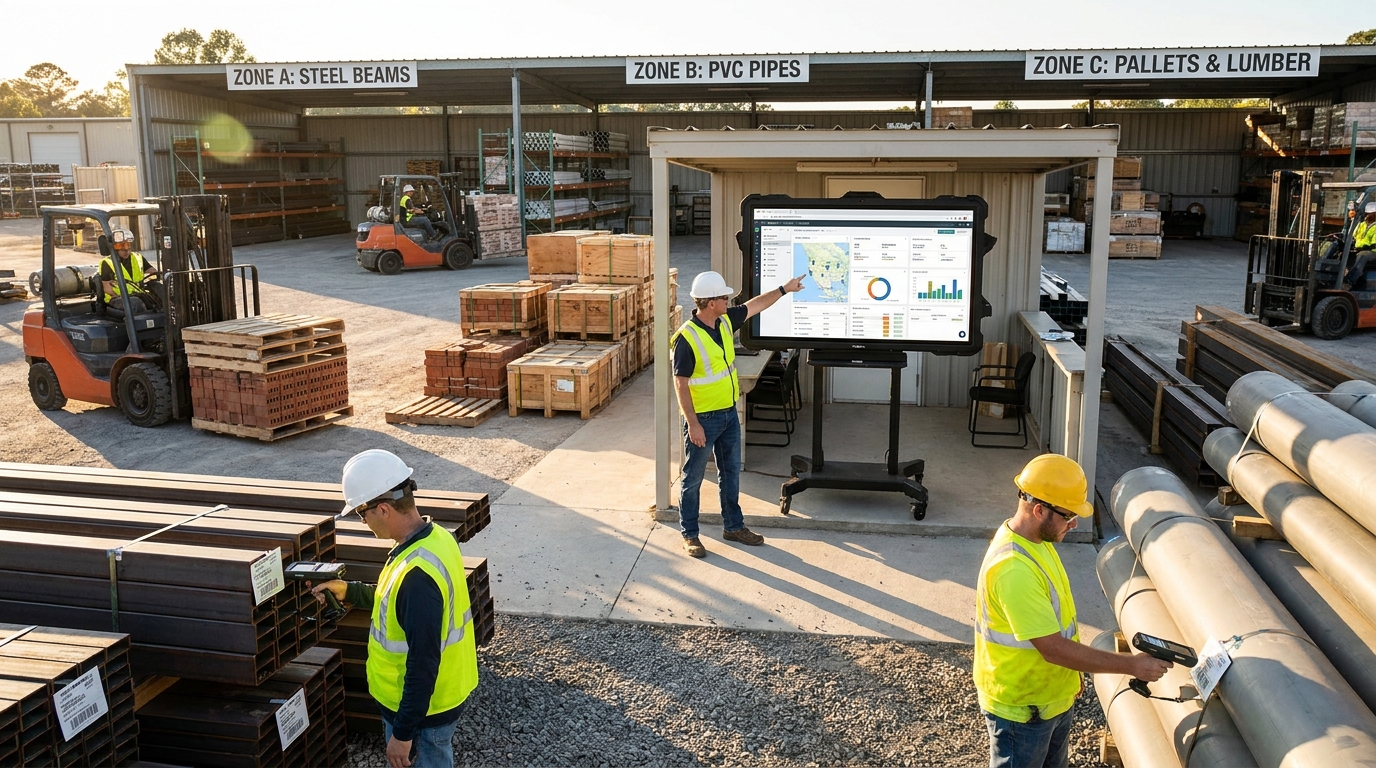
Inventory and warehouse data also deserves more attention than it often gets in construction. Some firms maintain decentralized storage yards or project-specific laydown areas with little formal tracking. Others have shared warehouses but weak visibility into what is available, reserved, damaged, or obsolete. Analytics becomes much more useful when materials are coded clearly and movements are recorded in a standardized way. This creates opportunities to reduce duplicate purchasing and redeploy surplus across jobs.
Supplier data completes the picture. Teams should know how vendors perform on lead-time reliability, order accuracy, substitution frequency, responsiveness, pricing stability, and issue resolution. Many companies assume they understand supplier quality because relationships are long-standing, but without scorecards the picture can be distorted by memory and anecdote. A supplier that appears cost-effective may be creating hidden losses through missed deliveries and field disruption.
Foundational systems that support analytics
Construction firms do not need every tool at once, but a few systems consistently strengthen supply chain analytics. ERP platforms help centralize financial and purchasing records. BIM can improve quantity visibility and connect design changes to procurement implications. Supplier relationship management tools support more consistent vendor tracking. Inventory systems improve material traceability. Dashboard platforms make trends easier to interpret across roles. The exact stack matters less than the discipline of standardization.
One of the most common mistakes is assuming that more software automatically creates better analytics. It does not. If cost codes vary from job to job, if item descriptions are inconsistent, or if teams bypass systems for urgent purchases, the resulting data will still be weak. Strong analytics depends on governance, naming standards, and process discipline as much as technology. In construction, useful data is almost always a management issue before it becomes a software issue.
Practical use cases that deliver real value
The best way to understand construction supply chain analytics is to look at what it actually helps teams do. The most valuable use cases are not always the most complex. They are the ones that improve day-to-day decisions where cost, schedule, and operational risk meet.
Material demand forecasting
Demand forecasting helps teams estimate when and how much material will be needed based on schedules, quantities, crew production rates, and project phase. In a fragmented industry, over-ordering is common because teams fear shortages, while under-ordering happens when schedules shift and updates are not reflected in purchasing plans. Better forecasting reduces both errors. It allows procurement teams to release orders earlier for long-lead items while avoiding unnecessary storage costs for materials that are not yet needed.
Predictive analytics is increasingly useful here. Historical data from similar project types can help forecast demand curves by trade and phase. If previous multifamily builds show repeated acceleration in framing consumption during a particular window, teams can use that pattern to plan more accurately on current jobs. The forecast will never be perfect, but it will be more grounded than intuition alone.
Lead-time risk detection
Quoted lead times are often treated as fixed, but real performance varies by vendor, product category, season, region, and market conditions. Lead-time analytics compares promised timelines to actual delivery history and flags items with elevated risk. This is especially important for components such as electrical equipment, HVAC systems, windows, elevators, and fabricated steel where delays can affect critical path activities.
Teams can also use scenario planning here. If a key item slips by two weeks, what tasks are affected, what trades are displaced, and what alternatives exist? If tariffs increase steel pricing again, what exposure exists in bids not yet locked? If diesel costs rise further, which projects have the highest freight sensitivity? These are practical planning questions, and analytics helps answer them before the crisis is immediate.
Procurement spend analytics
Spend analytics reveals where money is going, where pricing variance is occurring, and where vendor concentration creates risk. Many builders negotiate based on recent experience, but a structured view across projects often tells a more useful story. It can show whether the business is missing volume leverage by buying similar materials through too many vendors, whether emergency purchases are inflating costs, or whether some branches consistently pay more for the same categories than others.
This capability is especially important in periods of cost inflation. With raw materials, labor, and energy all cited as major obstacles by construction businesses, leaders need more than anecdotal awareness of rising costs. They need category-level visibility, trend lines, and comparison points. That clarity supports better client communication, better budgeting, and more disciplined escalation tracking.

Inventory optimization
Inventory optimization in construction is often less mature than in manufacturing, but the opportunity is significant. Analytics can show which items should be stocked centrally, which should be delivered just in time, and which categories regularly become surplus due to design revisions or inaccurate ordering. It can also help determine practical buffer levels for materials with unstable lead times.
The goal is not to minimize inventory at all costs. In a volatile market, zero buffer can be as dangerous as overstocking. The right question is where buffer inventory creates genuine protection versus where it simply ties up cash and clutters job sites. Data helps answer that question more objectively.
Supplier performance scorecards
Supplier relationships are still built on trust, but analytics makes that trust measurable. Scorecards can track on-time delivery, order completeness, defect rates, quote responsiveness, substitution rates, and dispute resolution speed. This helps procurement teams strengthen relationships with reliable partners while addressing chronic underperformance with evidence rather than frustration.
It also improves sourcing strategy. If a lower-priced supplier regularly causes downstream disruption, the apparent savings may not be real. When performance is measured systematically, total value becomes easier to assess. That is especially useful in markets where tariff exposure, fuel sensitivity, or nearshoring decisions may shift the optimal supply base.
How to build a construction supply chain dashboard that people actually use
Dashboards fail when they are designed for presentation rather than action. In construction, useful dashboards are role-specific, current enough to guide decisions, and simple enough that teams trust them under pressure. A project manager needs a different view from a procurement director, and a superintendent needs a different view from finance. The best dashboard strategy starts by asking what each role must decide every day or every week.
For project teams, the most useful dashboard elements often include long-lead item status, deliveries due in the next two weeks, materials at risk against schedule, open procurement issues, and major cost variances. For procurement leaders, spend by category, supplier scorecards, late shipment patterns, and quote cycle times are more important. For executives, the priorities may be portfolio-wide risk exposure, inflation pressure, concentration risk by vendor, and forecasted impact on margin or schedule.
It is also important to define a limited set of key performance indicators. Too many metrics dilute attention and encourage teams to ignore the dashboard entirely. In most firms, a useful starting set includes on-time delivery rate, actual versus quoted lead time, purchase price variance, emergency purchase frequency, inventory turns for key categories, supplier defect rate, and material-related schedule delay incidents. These indicators are not the whole story, but they create a baseline for continuous improvement.
Data refresh frequency matters too. Some decisions need daily visibility, especially for active deliveries and urgent constraints. Others can be reviewed weekly or monthly. A common mistake is promising real-time data across everything when underlying processes are not reliable enough to support it. Better to maintain trusted daily and weekly views than to display unstable live data that causes teams to lose confidence.
Implementation steps for companies of different sizes
There is no single maturity path, but most successful implementations move through clear stages. Smaller firms often make the most progress by starting narrow and proving value quickly. Larger firms usually need stronger data governance because inconsistency across business units can undermine even expensive tools.
- Audit existing data. Identify where purchasing, schedule, inventory, and supplier data currently lives. Look for duplicate sources, inconsistent naming, and manual workarounds.
- Standardize key fields. Create consistent item descriptions, cost codes, supplier IDs, project naming rules, and status definitions. Without this step, analysis will remain unreliable.
- Choose a few high-value use cases. Focus first on issues that create clear pain, such as long-lead tracking, spend variance, or supplier on-time performance.
- Build simple dashboards. Start with practical reporting that supports weekly decisions. Complexity can come later.
- Create ownership. Assign responsibility for data quality, dashboard maintenance, and issue follow-up. Analytics without ownership becomes passive reporting.
- Review and refine. Use monthly reviews to compare forecast versus actual results and improve the model over time.
For small and mid-sized contractors, this can begin with a disciplined spreadsheet model or a business intelligence layer connected to accounting and schedule exports. The misconception that analytics requires a massive technology budget often prevents action. In reality, a modest dashboard that flags overdue submittals, delayed purchase orders, and unreliable vendors can already reduce risk meaningfully.
For larger organizations, cross-project benchmarking becomes especially valuable. Centralized procurement data can reveal which teams forecast accurately, which regions face repeated logistics bottlenecks, and which supplier relationships create the strongest outcomes. This supports not only project execution but also organizational learning, which is often weak in a project-based industry.
Common challenges and how to address them
The biggest challenge is usually not a lack of data. It is poor data quality. Material descriptions may be entered differently by different buyers, schedule activities may not align with procurement categories, and vendor names may exist in multiple versions across systems. More data is not automatically better. Construction teams need clean, standardized, project-level data and consistent naming, coding, and cost structures to make analytics useful.
Another challenge is adoption. If field teams and buyers see analytics as extra administrative work with little benefit, the program will stall. The solution is to design outputs that make people’s jobs easier. When a superintendent can quickly see which deliveries are at risk next week, or when a buyer can compare actual vendor performance instead of searching email chains, adoption improves because the tool saves time.
There is also the issue of fragmented accountability. Procurement may own purchase orders, project teams may own schedules, warehouse staff may own inventory records, and finance may own cost reporting. Analytics works best when leaders treat these not as isolated functions but as linked parts of project delivery. Shared governance, recurring review meetings, and a common vocabulary help bridge these gaps.
Finally, companies must resist the temptation to expect instant transformation. Analytics improves gradually as data quality improves and teams learn which metrics predict problems most reliably. Early dashboards may expose uncomfortable truths, such as chronic expediting, repeated over-ordering, or inconsistent supplier discipline. That is not failure. It is the beginning of operational clarity.
Advanced trends shaping the next generation of construction supply chain intelligence
Several trends are expanding what analytics can do in this space. Predictive analytics is becoming more common for material demand forecasting, lead-time risk detection, and cost escalation tracking. Rather than just reporting what happened, firms are building models that estimate what is likely to happen next. This shift is particularly valuable in volatile markets where reaction speed matters.
Digital twins and BIM-connected analytics are also gaining traction. When design information, quantities, schedule logic, and procurement status are linked more tightly, teams can see how design revisions affect purchasing exposure and site logistics. This is especially promising for infrastructure and complex building projects where sequencing and material dependencies are difficult to manage manually.
Geospatial analytics is another growing area, particularly for road construction, civil work, and regional builder networks. Mapping suppliers, haul distances, congestion patterns, and fuel-sensitive routes helps companies understand logistics risk more clearly. With diesel price increases affecting transportation costs, location intelligence is becoming more operationally important than before.
North American firms are also paying more attention to tariff exposure, nearshoring, and reshoring strategies. If trade friction raises the cost or uncertainty of imported metal products, organizations need better visibility into where those exposures sit across bids and active projects. Analytics supports this by linking material categories, supplier geographies, and contract commitments in a more structured way.
What success looks like in practice
A successful construction supply chain analytics program does not necessarily look flashy. It looks organized. Project teams know which materials are critical, procurement leaders know which suppliers are slipping, finance understands where inflation is hitting hardest, and executives can see portfolio-wide exposure before it becomes a margin problem. Meetings become more focused because fewer conversations are driven by guesswork.
Operationally, success often shows up as fewer emergency orders, more stable delivery planning, lower material waste, stronger supplier accountability, and better alignment between schedule and procurement. Over time, firms also gain institutional memory. They stop relearning the same lessons on every project because purchasing, delivery, and performance data is captured and compared consistently.
There is also a strategic benefit. As clients become more cost-conscious and timelines remain pressured, contractors who can explain risk with evidence gain credibility. They can justify contingencies more clearly, communicate procurement constraints earlier, and demonstrate that their planning is grounded in observed market conditions. In a sector shaped by uncertainty, that level of transparency can be a differentiator.
Conclusion: analytics as the intelligence layer behind better building
Construction supply chains will not become simple anytime soon. The industry still faces fragmented delivery structures, declining productivity pressures, unstable materials markets, labor constraints, and transportation cost volatility. Statistics Canada data and broader global research both point in the same direction: disruption is no longer occasional background noise. It is part of the operating environment. The firms that perform best will not be the ones that avoid uncertainty entirely. They will be the ones that see it earlier and respond more intelligently.
That is the role of supply chain analytics. It turns purchasing records, schedule data, vendor history, inventory movements, and cost signals into a clearer picture of what is happening and what is likely to happen next. It does not replace field expertise, supplier relationships, or project leadership. It strengthens them. For construction companies looking to reduce waste, protect schedules, and make better decisions under pressure, analytics is no longer a nice extra. It is becoming a core capability.
The practical starting point is straightforward. Standardize your data, focus on a few high-value use cases, build dashboards that support real decisions, and review performance consistently. Whether you are a small contractor tracking a handful of active jobs or a large builder managing a national supplier network, the principle is the same. Better information leads to better coordination, and better coordination is one of the most reliable paths to better project outcomes.



No Comment! Be the first one.