



Real estate sales performance has become more complex than the old shorthand of counting closed transactions and calling it a trend. In a market shaped by changing mortgage costs, affordability pressure, local supply imbalances, and different recovery speeds across regions, sales numbers alone can mislead even experienced participants. A city can post more closings than the month before while sellers quietly lose negotiating power, or prices can appear stable even as the mix of homes being sold changes underneath the surface.
Table Of Content
- Why Sales Performance Needs More Than Sales Counts
- The Core Metrics That Define Real Estate Sales Performance
- Closed Sales
- Pending Sales
- Months of Inventory
- Days on Market
- Sale-to-List Price Ratio
- Median and Average Sale Prices
- How the Metrics Work Together
- What 2026 Data Signals About Market Conditions
- Why Local Market Segmentation Matters More Than National Headlines
- How to Build a Practical Sales Performance Dashboard
- A Simple Dashboard Structure
- Methodological Traps That Distort Sales Trend Analysis
- Using Data Analytics to Improve Agent Performance
- How Buyers and Sellers Can Use the Same Metrics Differently
- From Historical Reporting to Forecasting
- Common Misreadings That Lead to Poor Decisions
- The Strategic Value of Data Literacy in Real Estate
- Conclusion
That is why a data-driven approach matters. Instead of asking only how many homes sold, the better question is what the sales environment is actually signaling. Analysts, agents, buyers, and sellers now need a layered view that includes months of inventory, days on market, sale-to-list price ratios, pending sales, median and average prices, and region-specific context. Each metric reveals a different piece of market behavior, and together they form a much more reliable picture of demand, pricing strength, liquidity, and timing.
Recent North American housing data makes this especially clear. In the United States, the National Association of Realtors reported June 2026 existing-home sales at 4.09 million, a median sales price of $440,600, and 4.6 months of inventory. In Canada, the Canadian Real Estate Association reported 4.8 months of inventory nationally at the end of May 2026, close to its long-term average of five months, while the National Composite MLS Home Price Index slipped just 0.1% month over month, a sign of stabilization rather than broad acceleration or collapse. These numbers tell a richer story than headline sales volume because they begin to explain why transactions are happening and under what conditions.
This article explains how to analyze real estate sales performance with discipline and clarity. It covers the most useful metrics, the ways they interact, the mistakes people make when interpreting them, and how market dashboards can turn raw housing data into better decisions. Whether you are an agent tracking pipeline quality, a brokerage leader evaluating team results, or a buyer trying to judge when competition is easing, the goal is the same: to replace guesswork with informed interpretation.

Why Sales Performance Needs More Than Sales Counts
Closed sales are important because they confirm that transactions made it across the finish line. They reflect deals that survived financing, inspections, negotiations, and closing timelines. But closed sales are also backward-looking. By the time a property appears in a sales report, the buyer decision was often made weeks earlier. If you rely only on closings, you are looking at the market through a rearview mirror.
A more useful approach combines lagging indicators and leading indicators. Closed sales, average price, and median price help explain what has already happened. Pending sales, new listings, inventory changes, and days on market help forecast what is likely to happen next. This distinction matters because housing markets do not shift all at once. Buyer interest may start improving before prices respond, and inventory may rise before sellers fully recognize that pricing power is fading.
There is also the problem of false confidence. Higher sales volume does not automatically mean a healthier market. If sales rise while listings increase faster, days on market lengthen, and sale-to-list ratios soften, the market may be active but less competitive. That distinction affects pricing strategy, offer strategy, marketing timelines, and expectations on both sides of the transaction.
In practical terms, real estate performance analysis should answer four linked questions. First, how much demand exists right now. Second, how much supply is competing for that demand. Third, how efficiently listings are converting into offers and closings. Fourth, whether pricing power is strengthening, weakening, or simply stabilizing. Once those questions are answered with data instead of instinct, decisions become sharper.
The Core Metrics That Define Real Estate Sales Performance
The strongest performance frameworks do not rely on one star metric. They combine several indicators because every metric has blind spots. The real value comes from reading them together and understanding which ones lead and which ones lag.
Closed Sales
Closed sales remain the most familiar measure of market activity. They represent finished transactions and help quantify turnover, market participation, and broad consumer confidence. For agents and brokerages, closings also influence revenue, conversion analysis, and production rankings.
But closings have limitations. They may rise because a backlog of earlier pending deals is finally settling rather than because fresh demand is surging today. They can also look strong in a market where sellers are cutting prices to move inventory. That is why closed sales should be treated as a foundation metric, not a complete diagnosis.
Pending Sales
Pending sales are one of the most useful forecasting tools in housing analytics. They capture homes that are under contract but not yet closed, which makes them a stronger near-term signal of demand. If pending sales improve before closed sales do, market momentum may be turning. If pending sales weaken while closings still appear stable, a slowdown may already be underway.
National analysts use pending data for this exact reason. It helps bridge the timing gap between buyer activity and final sales reporting. For agents, pending sales can also reveal whether showings are translating into offers or whether buyers remain active but hesitant.
Months of Inventory
Months of inventory is one of the clearest ways to understand negotiating leverage in a housing market. CREA defines it as the number of months it would take to sell current inventory at the current sales pace. That definition makes it more than a count of available listings. It is a measure of market absorption.
Low inventory usually signals tighter competition and stronger seller leverage, all else equal. Higher inventory suggests buyers have more choice and more negotiating room. In May 2026, CREA reported 4.8 months of inventory nationally in Canada, close to the long-term average of five months. In the U.S., NAR reported 4.5 months of supply in May 2026 and 4.6 months in June 2026. Numbers like these often point to a more balanced environment than the extreme scarcity seen in hotter periods.
Days on Market
Days on market measures how quickly listings are being absorbed. It is often confused with inventory, but the two are not the same. Inventory measures the relationship between stock and sales pace across the market. Days on market measures the typical time a listing needs to attract a buyer and move through the competitive funnel.
When days on market declines, homes are moving faster. That can signal strong pricing, scarce supply, or effective marketing. When it rises, the cause could be affordability stress, overpricing, weaker demand, or an increase in competing listings. This is why days on market works best when paired with sale-to-list price ratios and new listing trends.
Sale-to-List Price Ratio
The sale-to-list price ratio shows how close final sale prices are to asking prices. It is one of the cleanest measures of pricing power because it reflects the outcome of negotiation. A ratio near or above list price often suggests intense competition or highly accurate pricing. A lower ratio can indicate softer leverage, more concessions, or inflated asking prices.
For buyers, this metric helps estimate whether aggressive bids are still necessary. For sellers and agents, it helps judge whether listing strategy aligns with current market tolerance. Redfin reported that 24.9% of U.S. homes sold above list price in May 2026, which is useful not because it tells the whole story, but because it quantifies competitive intensity in a way simple sales totals cannot.
Median and Average Sale Prices
Price metrics seem straightforward, but they require more care than many people realize. Median sale price shows the midpoint of all transactions and is less influenced by extreme high-end or low-end outliers. Average price captures the overall mean and can swing more dramatically when luxury activity increases or declines.
Neither number should be treated as a pure measure of home value change. If more detached homes sell this month and more condos sold last month, the median may rise even if underlying prices are flat. This is why benchmark indexes such as the MLS Home Price Index are valuable. In Canada, CREA reported that its National Composite MLS Home Price Index edged down just 0.1% month over month in May 2026 and was down 4.1% year over year, suggesting stabilization after earlier weakness. That is a more nuanced signal than median price alone would provide.
How the Metrics Work Together
The real power of analytics appears when metrics are interpreted in combination. One metric can tell a partial truth. Several metrics together can tell the market story. This is the shift from reading statistics to reading structure.
Imagine sales volume rises month over month. On the surface, that sounds positive. But if inventory also rises, days on market lengthens, and sale-to-list ratios slip, the market may simply be more active because buyers have more options and sellers are becoming more flexible. In that case, volume is improving, but pricing power is not. Agents who miss that distinction may overprice listings and extend time to sale.
Now imagine the opposite. Sales volume is flat, but pending sales are rising, days on market is falling, and the share of homes selling near or above list price is improving. That combination can indicate a turning market where buyer confidence is returning before official closings reflect it. Buyers waiting for headline sales reports may react too late, while agents tracking live metrics can adjust sooner.
This layered interpretation matters more in a slower, more balanced market. In a frenzy, most indicators move in the same direction. In a cooling or bifurcated market, they do not. That is when analytics creates the most value because the easy narrative stops working.
Key insight: In real estate, stronger activity does not always mean stronger leverage. Sales performance should be read through the combined lens of speed, supply, pricing, and competition.
What 2026 Data Signals About Market Conditions
Current North American data points to a market that is slower than peak-pandemic conditions but more informative for analysts. The United States has shown modest improvement in sales alongside higher inventory. NAR reported June 2026 existing-home sales of 4.09 million at a median sales price of $440,600, with 4.6 months of inventory. NAR also reported a 3.2% month over month increase in May 2026 existing-home sales, 1.55 million unsold homes, 4.5 months of supply, and a median price of $429,300. This combination suggests activity has improved, but available stock has also grown, which tends to moderate seller control.
Canada presents a similarly nuanced picture. CREA reported 4.8 months of inventory nationally at the end of May 2026, near the long-run average, while the National Composite MLS Home Price Index showed only a slight month over month decline. That does not point to a universal rebound, nor does it signal broad deterioration. It points to stabilization with local variation, which is exactly the kind of environment where superficial readings become risky.
CMHC’s 2026 housing outlook adds another important layer. It expects Canadian home sales to increase gradually but remain below historical averages through 2028 due to slower population growth, high borrowing costs, uncertainty, and modest income growth. That means analysts should be careful not to label every short-term improvement a full recovery. Some rebounds are cyclical and temporary. Others reflect durable shifts in affordability or migration patterns. Data helps separate the two.
The common theme across these sources is that markets are becoming more balanced and more segmented. Buyers are not behaving the same way across all price bands, neighborhoods, and property types. Sellers cannot assume that last year’s pricing playbook still works. And agents who want to outperform need to understand where conditions are improving, where they are plateauing, and where they remain soft despite better headlines.
Why Local Market Segmentation Matters More Than National Headlines
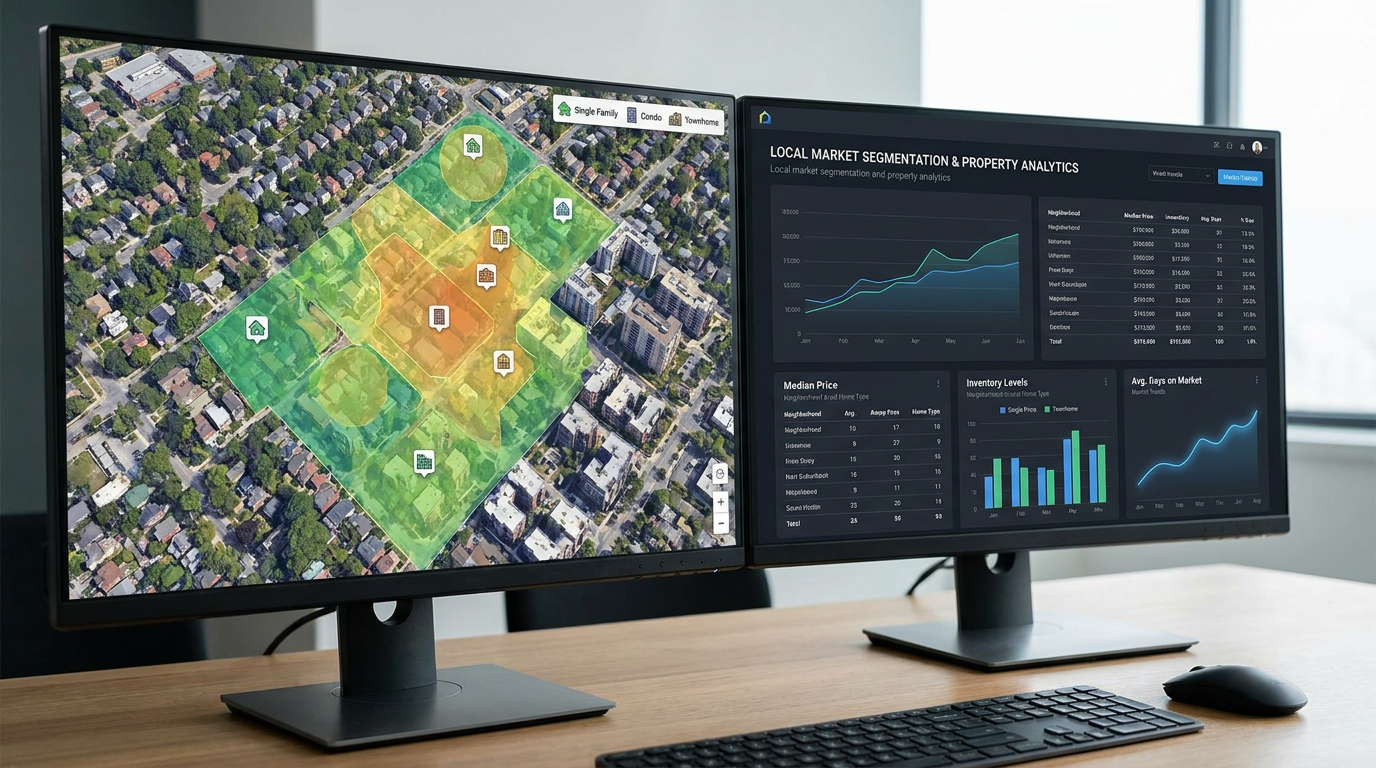
One of the most important truths in real estate analytics is that there is no single housing market. There are only nested markets. National trends matter, but they often mask differences between provinces, metro areas, neighborhoods, and property types. A balanced national market can contain overheated submarkets and weak micro-markets at the same time.
This is especially visible in Canada, where CMHC highlights different trajectories across Ontario, British Columbia, the Prairies, Quebec, and major census metropolitan areas. The same pattern exists in the United States across regions, suburban rings, downtown condo segments, and affordability tiers. The lesson is simple: performance should be benchmarked locally before it is generalized broadly.
For example, detached homes in one suburban district may still sell quickly with limited discounting, while condominiums in the urban core may require longer marketing times and sharper pricing. If an agent compares performance across these segments without adjustment, the conclusion will be flawed. What looks like weak execution may actually reflect a more difficult product category. What looks like exceptional pricing may simply reflect a scarcer property type.
That is why modern market dashboards increasingly break performance down by neighborhood, property class, price band, and time period. This micro-market view makes analytics operational. It helps a listing agent set expectations with precision, helps buyers recognize where leverage is shifting, and helps brokerage leaders identify which segments are driving or dragging overall results.
How to Build a Practical Sales Performance Dashboard
A useful dashboard should not overwhelm users with every available statistic. It should organize a small set of indicators around clear decisions. The best dashboards answer whether the market is speeding up or slowing down, whether pricing power is holding or fading, and whether short-term conditions support urgency or patience.
At minimum, a dashboard for real estate sales performance should include closed sales, pending sales, new listings, active inventory, months of inventory, median days on market, sale-to-list price ratio, median sale price, average sale price, and a benchmark price index where available. It should also allow segmentation by geography and property type. Without segmentation, averages become dangerous.
Visual structure matters too. Trend lines over three, six, and twelve months are usually more useful than isolated monthly snapshots. Ratios and rates often tell clearer stories than raw counts. A well-designed dashboard should also show year over year and month over month views so users can distinguish seasonal movement from genuine structural change.
For agents, the practical output of this dashboard is better advice. If pending sales are rising but months of inventory remains elevated, the message to sellers may be cautiously optimistic rather than aggressively bullish. If sale-to-list ratios are falling in a condo segment while detached homes hold steady, pricing strategy should diverge. The point is not to produce more charts. The point is to turn evidence into action.
A Simple Dashboard Structure
- Demand indicators: closed sales, pending sales, showing activity if available.
- Supply indicators: active listings, new listings, months of inventory.
- Speed indicators: days on market, absorption rate, list-to-pending time.
- Pricing indicators: median price, average price, sale-to-list ratio, benchmark index.
- Segmentation filters: neighborhood, property type, price band, bedroom count, postal code or ZIP code cluster.
Even a modest dashboard built around these categories can outperform intuition. It creates a repeatable method for evaluating whether a market is becoming tighter, softer, more liquid, or more fragmented.
Methodological Traps That Distort Sales Trend Analysis
Data can improve decisions only when it is interpreted correctly. Real estate metrics are full of methodological caveats, and ignoring them is one of the fastest ways to reach the wrong conclusion with confidence. The first trap is seasonality. Housing is not evenly active throughout the year. Spring often behaves differently from winter, and summer may differ from late fall. NAR explicitly notes that annualizing and seasonally adjusting existing-home sales data is necessary so monthly and quarterly comparisons are not distorted by normal seasonal patterns.
The second trap is property mix. Median prices can move because more expensive homes sold this month, not because each individual home became more valuable. Average price is even more sensitive to this effect. Analysts should compare similar product categories and, when possible, use benchmark indexes such as the MLS Home Price Index to isolate underlying price movement more accurately.
The third trap is geography. Combining multiple neighborhoods into one number can hide opposite trends. A city-level median may appear stable while entry-level segments weaken and luxury detached homes strengthen. This matters for both performance evaluation and forecasting because different buyer groups respond differently to mortgage rates, employment changes, and inventory shifts.
The fourth trap is mistaking correlation for causation. Inventory may rise because demand is weakening, but it may also rise because new listing activity is recovering. Days on market may increase because homes are overpriced, but it may also reflect a higher share of larger or more expensive homes coming to market. Analysts need context before assigning reasons to movements.
The fifth trap is comparing data series without understanding methodology. Statistics Canada has noted that CREA’s MLS Home Price Index replaced its earlier resale price index for resale data, which is a useful reminder that not all price series are directly interchangeable. Before comparing periods or sources, analysts should confirm definitions, seasonal adjustment methods, and geographic coverage.
Using Data Analytics to Improve Agent Performance
For agents and teams, sales performance analytics is not just about market commentary. It is a management tool. It can reveal whether a problem is lead quality, pricing strategy, listing presentation, negotiation strength, or market selection. When used consistently, data replaces vague explanations with measurable patterns.
Start with the listing side. Compare each listing’s days on market, price reductions, showing volume, and final sale-to-list ratio against local segment benchmarks. If an agent’s properties consistently take longer to sell than similar listings, the issue may be marketing, staging, pricing, or expectation setting. If sale-to-list ratios are weaker than the micro-market average, negotiation outcomes may need review.
On the buyer side, analytics can improve offer strategy and search efficiency. If a segment shows declining sale-to-list ratios and increasing inventory, buyers may not need to waive as much or rush as aggressively. If pending sales are rising and supply is tightening in a specific school district, hesitation may become expensive. Agents who know these patterns can guide clients with more credibility and less emotion.
Brokerage leaders can also use analytics to coach more effectively. Instead of evaluating productivity only by annual volume, they can assess how agents perform relative to market conditions. Selling ten homes in a difficult segment with strong pricing outcomes may be more impressive than selling twelve in an easier one. Context makes performance evaluation fairer and more actionable.

How Buyers and Sellers Can Use the Same Metrics Differently
One of the strengths of real estate analytics is that the same dataset can support different decisions. Buyers, sellers, investors, and agents all care about timing and value, but they apply the signals in different ways. Understanding these different use cases makes the metrics more practical.
For buyers, months of inventory and days on market indicate how much leverage may exist in negotiation. Rising inventory and slower absorption can mean more room for contingencies, more time to compare options, and less pressure to overbid. Pending sales help buyers judge whether that leverage is likely to persist or fade in the near term.
For sellers, the sale-to-list price ratio and recent price trend data matter more directly. If comparable homes are selling below asking price and taking longer to move, aspirational pricing becomes riskier. A seller in a fast segment may still benefit from tight pricing and strong launch timing, but a seller in a softer segment may gain more by pricing realistically on day one.
For investors, the focus often shifts to liquidity and spread. Days on market and inventory help estimate exit risk, while pricing trends and affordability constraints shape entry strategy. A market with stable prices but slower absorption may still be attractive if acquisition discounts improve. Data does not decide the investment on its own, but it greatly improves the quality of the thesis.
From Historical Reporting to Forecasting
The most advanced use of sales performance analytics is forecasting. This does not mean trying to predict exact home prices six months from now with false precision. It means using leading indicators to estimate direction, pressure, and probability. In practical housing analysis, that is often more useful than point prediction.
Pending sales are central to this shift because they indicate whether current buyer demand is likely to turn into stronger future closings. New listings help forecast whether inventory pressure will build or ease. Changes in days on market can signal turning points in absorption before official sales data catches up. Sale-to-list ratios often reveal changes in negotiation conditions before benchmark price indexes fully respond.
Forecasting also improves when analysts track signals by segment rather than market-wide averages. An affordable suburban segment may tighten sooner than a downtown condo segment because mortgage sensitivity and buyer profiles differ. A luxury niche may show weaker volume but stable pricing because inventory remains scarce. Forecasts become more realistic when they respect market heterogeneity.
In this sense, analytics becomes a decision-support system rather than a monthly scorecard. It helps answer whether to list now or wait, whether to price for competition or margin, whether to negotiate harder or move faster, and whether a rebound is broad-based or only visible in selected pockets.
Common Misreadings That Lead to Poor Decisions
- Assuming higher sales volume means a healthier market. Volume should always be read alongside inventory, days on market, and pricing trends.
- Using median price as a stand-alone truth. The median can move because the mix of homes sold changes.
- Treating national data as local guidance. Broad trends can hide major city, neighborhood, and property-type differences.
- Confusing months of inventory with days on market. One measures supply relative to sales pace, while the other measures listing speed.
- Ignoring seasonality. Month to month changes without adjustment often exaggerate or understate real momentum.
These mistakes are common because they simplify a complicated market into a single storyline. But simplicity becomes expensive when pricing, timing, or negotiation depends on it. The better habit is to ask what each metric measures, what it does not measure, and what other indicator should confirm it.
The Strategic Value of Data Literacy in Real Estate
As the industry becomes more digital, data literacy is turning into a competitive advantage. Clients now expect more than instinct and anecdote. They expect evidence, context, and an explanation of what the numbers mean for their exact situation. The professionals who can translate market data into calm, specific advice will stand out.
This is not about turning every agent into a statistician. It is about building analytical habits. Know which metrics lead and lag. Compare local results with broader baselines. Segment before generalizing. Normalize for seasonality and product mix. Track changes over time instead of reacting to one headline. These habits create better pricing conversations, better client communication, and better strategic choices.
The same is true for buyers and sellers. A data-literate buyer can distinguish a genuinely softening segment from one that only looks quieter because of seasonality. A data-literate seller can understand why last year’s neighborhood comps may not justify today’s asking price. Better interpretation creates better expectations, and better expectations usually produce better outcomes.
Conclusion
Analyzing sales performance trends in real estate requires more than reading headline transaction counts. The most useful view combines supply, demand, speed, pricing, and competition into one coherent framework. Metrics such as months of inventory, days on market, pending sales, sale-to-list price ratio, and benchmark price indexes help reveal not just what happened, but what is changing and why it matters.
Recent data from NAR, CREA, CMHC, Redfin, and other authoritative sources points to a market that is more balanced, slower than peak periods, and increasingly segmented by region and property type. That environment rewards careful interpretation. It punishes oversimplified narratives. In other words, this is exactly the kind of market where data analytics becomes indispensable.
For agents, analytics sharpens pricing, coaching, and client strategy. For buyers, it clarifies leverage and timing. For sellers, it improves expectation setting and launch decisions. For the broader industry, it turns housing data from passive reporting into an active intelligence layer. That is the real promise of a data-driven approach to sales performance: not just more information, but better judgment.



No Comment! Be the first one.