



Real estate decisions often look simple from the outside. A market seems hot, prices are rising, a new development is announced, and investors move quickly. Yet the strongest decisions are rarely built on headlines alone. They come from a more disciplined process of estimating who will buy, who will rent, how many units the market can absorb, and whether those patterns are likely to strengthen or weaken over time. That process is known as demand forecasting in real estate.
Table Of Content
- What demand forecasting means in real estate
- Why demand forecasting matters for smarter real estate decisions
- The core inputs behind a real estate demand forecast
- The most useful data sources for housing demand forecasting
- Why local context matters more than national averages
- Key indicators that reveal future housing demand
- How scenario-based forecasting improves decision making
- Where AI and modern analytics tools are changing forecasting
- Common misconceptions that weaken demand forecasts
- Applying demand forecasting to real decisions
- A practical framework for building a demand forecast
- What the current market teaches us about demand forecasting
- Conclusion: better forecasts lead to better real estate judgment
At its core, demand forecasting is about reducing uncertainty. It uses historical performance, demographic shifts, economic conditions, affordability trends, migration flows, and supply data to estimate future housing demand. For developers, lenders, brokers, investors, and even public agencies, forecasting is not just an academic exercise. It shapes land acquisition, pricing strategy, lease-up expectations, portfolio allocation, and risk management. In a market as cyclical and localized as housing, that intelligence can make the difference between disciplined growth and expensive misjudgment.
Demand forecasting has become even more important in a period marked by uneven affordability, shifting interest rates, and sharp regional divergence. According to CMHC’s 2026 Housing Market Outlook, housing demand in Canada is expected to remain low nationally, with sales below historical averages and modest price gains after 2025. At the same time, regional conditions differ meaningfully across Ontario, British Columbia, the Prairies, Quebec, and Atlantic Canada. That gap between national direction and local reality is exactly why modern real estate analytics matters.
This guide explains what demand forecasting really means, what data powers it, which indicators carry the most signal, and how analytics can turn raw housing information into better decisions. If you have ever wondered why one neighborhood fills new rentals in weeks while another struggles with vacancy, or why one city remains resilient despite weaker national sentiment, demand forecasting provides the framework for understanding those patterns with more clarity.
Key idea: Demand forecasting is not the same as trying to guess next year’s home price. It is a structured way to estimate future buyer, renter, and investor activity by combining data on people, affordability, economics, and supply.
What demand forecasting means in real estate
In practical terms, demand forecasting is the process of estimating future market activity for housing and real estate assets. That activity may include home purchases, rental absorption, lease-up velocity, investor appetite, occupancy trends, or sales volume by product type. A condominium developer might forecast how quickly units will be absorbed at different price points. A multifamily operator might forecast future rental demand by household type. A lender might forecast whether a local market can support another wave of construction without materially increasing vacancy.
The reason this distinction matters is that many people reduce forecasting to a single question: where will prices go next? Prices are important, but they are only one output of a larger system. A market can show stable or even rising prices while underlying demand is softening due to financing constraints. Conversely, a market can experience muted price growth while occupancy remains strong because population inflows continue to outpace available supply. Smart forecasting focuses on the drivers of demand, not just the most visible result.
In real estate analytics, demand forecasting usually connects several layers of information. Historical transaction data shows what has happened. Demographic and migration data shows who is arriving or forming households. Economic data shows whether those households can afford to buy or rent. Supply-side metrics such as housing starts, completions, and units under construction show how much product is coming to market. When these layers are combined well, they create a much clearer view of likely future conditions.
This is especially relevant in Canada, where housing affordability and supply pressures interact differently across major markets. CMHC has estimated that restoring affordability to 2019 levels would require roughly 430,000 to 480,000 new housing units annually over the next decade. That number is useful at the national level, but individual cities and submarkets still behave very differently. Forecasting is what translates broad housing pressure into a location-specific decision framework.
Why demand forecasting matters for smarter real estate decisions
Every real estate decision contains a forecast, whether it is formal or informal. When someone buys a rental property, they are implicitly forecasting rent growth, occupancy, expenses, and future liquidity. When a developer launches a project, they are forecasting demand at a given price point and within a particular delivery window. The question is not whether a forecast exists. The question is whether it is grounded in evidence.
Accurate demand forecasting improves decisions in several ways. First, it helps identify where actual market depth exists rather than where sentiment merely appears strong. A market may attract attention because of recent price gains, but if household formation is slowing and vacancy is rising, the foundation may be weaker than expected. Second, it improves timing. Entering a market at the wrong stage of the cycle can damage returns even if the long-term story is positive. Third, it clarifies product-market fit. Demand for family-sized rentals, entry-level condos, purpose-built rentals, and suburban townhomes can diverge even within the same metro.
For investors, forecasting helps separate growth stories from durable cash flow stories. For lenders, it sharpens underwriting and pipeline risk assessment. For brokers, it supports better advice on pricing, positioning, and location. For policymakers, it helps identify where shortages, mismatches, or affordability stress are likely to intensify. In each case, analytics moves the conversation from reactive interpretation toward structured planning.
There is also a risk management angle that should not be overlooked. Real estate is capital intensive, slow to adjust, and often dependent on financing conditions. If mortgage rates rise, labor markets weaken, or migration slows, demand can shift before newly delivered supply is fully absorbed. Forecasting does not eliminate these risks, but it makes them more visible earlier. That visibility is a competitive advantage.
The core inputs behind a real estate demand forecast
Strong forecasts begin with strong inputs. The most reliable models do not depend on a single metric. They combine demand drivers, market structure variables, and supply indicators to create a fuller view of how a housing market is evolving. Some inputs are broad and macroeconomic. Others are highly local. The best forecasting process knows how to use both without confusing one for the other.
Population growth is one of the most important starting points. Housing demand ultimately depends on people. More specifically, it depends on how many people are entering a market, how long they stay, how they form households, and what kind of housing they can afford. A city can experience population growth without equally strong ownership demand if incomes lag or financing costs remain high. In that case, rental demand may absorb most of the pressure. This is why headline population growth should always be paired with household formation and affordability analysis.
Migration is another high-signal variable. Domestic migration can shift demand from one region to another, while international migration often affects rental markets first before translating into ownership demand over time. Employment growth, wage levels, and labor market composition matter as well. A city adding stable, higher-income jobs will often support stronger housing demand than a city with similar population growth but weaker income conditions.
Interest rates and mortgage costs remain central to forecasting, particularly in North American markets. The National Association of Realtors projected existing-home sales in the United States to rise by about 14 percent in 2026, with mortgage rates expected to ease toward 6 percent. That kind of projection illustrates how financing conditions directly shape affordability and transaction volume. In real estate, many demand shifts do not happen because people suddenly lose interest in housing. They happen because the monthly payment changes.
Affordability metrics help convert broad economic information into market behavior. If home prices, rents, and borrowing costs rise faster than incomes, some households delay purchasing, stay in rentals longer, or move to more affordable submarkets. That is one reason rental demand has attracted greater attention recently. Affordability constraints can re-route demand without reducing it altogether.
Supply-side metrics are just as important because demand can only be understood in relation to what is available. CMHC’s housing market data includes housing starts, completions, units under construction, and absorbed or unabsorbed units. These are not just construction statistics. They are core indicators for balancing demand against available and incoming stock. If new completions are rising while absorption slows, pipeline risk increases. If vacancy remains low despite significant supply delivery, demand may be stronger than surface indicators suggest.
The most useful data sources for housing demand forecasting
Forecasting quality depends heavily on source quality. Public datasets remain the foundation of most serious real estate analysis because they provide scale, consistency, and methodological transparency. In Canada, CMHC is the most authoritative public source for housing market forecasting and housing data tables. Its outlooks and datasets cover starts, completions, rentals, affordability, sales activity, and market trends across the country and major census metropolitan areas. For anyone analyzing Canadian real estate demand, CMHC is not optional. It is essential.
CMHC’s value lies in both breadth and forward-looking context. Its outlooks do not simply report what happened last quarter. They frame where the housing market may be heading under changing rate, policy, and affordability conditions. That matters because real estate decisions are inherently future oriented. Developers and investors are not allocating capital based only on the last twelve months. They are trying to estimate the next twelve to thirty-six months and sometimes longer.
In the United States, the U.S. Census Bureau’s Housing Vacancies and Homeownership Survey is a particularly useful source. It tracks rental vacancy rates, homeowner vacancy rates, and homeownership rates by state and large metro areas, and it is also used as a leading economic indicator. Vacancy data is often underappreciated by non-specialists, but it is one of the strongest signals in demand forecasting because it reflects how quickly available stock is being absorbed relative to what the market can support.
Other valuable inputs include labor market statistics, migration estimates, building permit data, affordability indexes, multiple listing service data, rental listing platforms, and local planning or development application records. Increasingly, forecasting models also use alternative data such as online search behavior, mobility patterns, rent intelligence feeds, and listing engagement metrics. These newer sources can be especially useful for nowcasting, which means estimating near-term market conditions before official reports are fully released.
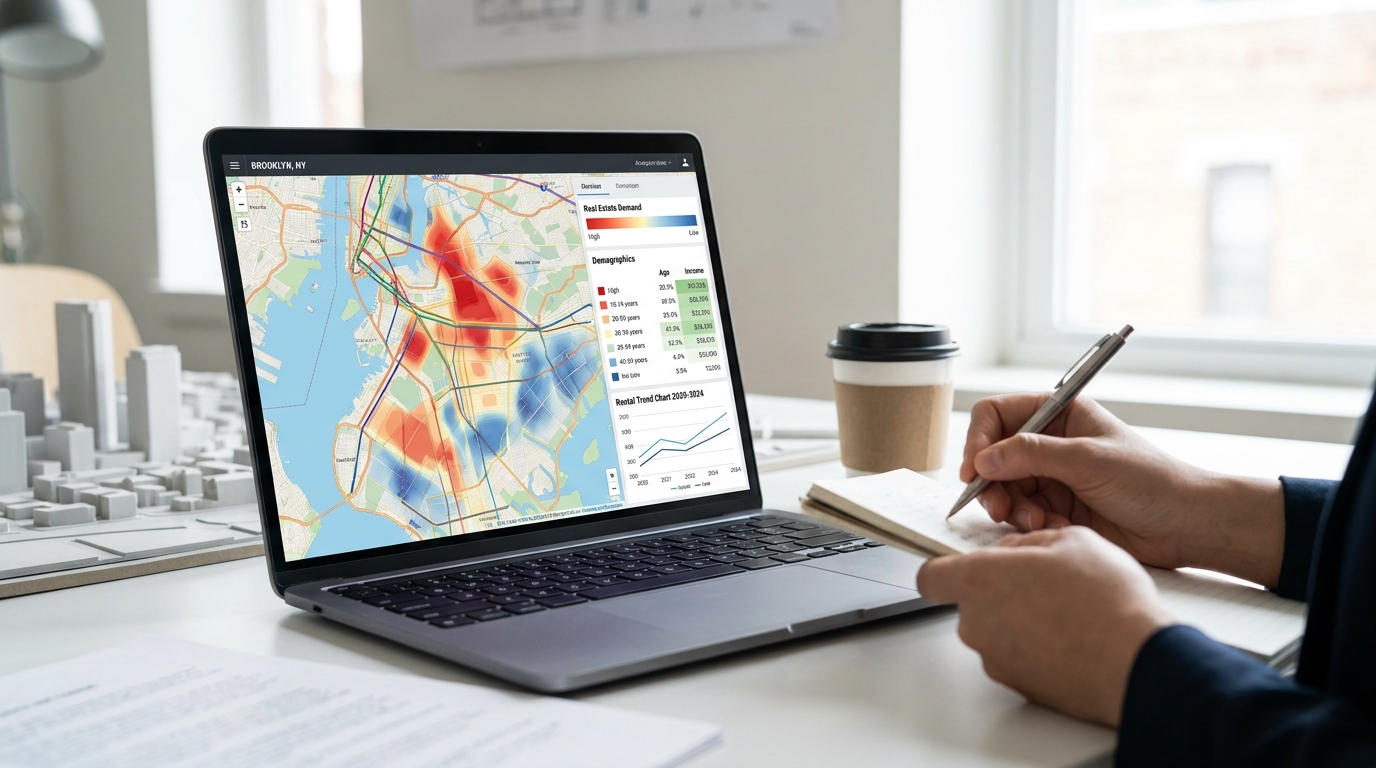
The rise of data dashboards has made this information far more usable for non-technical decision makers. Brokers, developers, lenders, and asset managers are adopting automated market intelligence tools to monitor local supply pipelines, rent shifts, inventory changes, and demand drivers in near real time. A good dashboard does not replace judgment. It improves it by organizing signal faster and making local trends easier to compare.
Why local context matters more than national averages
One of the biggest mistakes in real estate forecasting is relying too heavily on national data. National housing narratives can be useful for understanding direction, but real demand is highly local. A country can show weak sales overall while one metro remains structurally undersupplied. Another city may post healthy price resilience while quietly accumulating vacancy in specific rental submarkets. Broad averages smooth out exactly the variation that matters most for property-level decisions.
CMHC’s 2026 outlook highlights this clearly. While national housing demand is expected to remain low and sales are projected to stay below historical averages, regional markets are diverging significantly. Ontario and British Columbia may feel affordability and financing pressure differently than Prairie markets or Atlantic cities experiencing distinct migration and supply dynamics. If an investor treats these regions as a single demand story, they are likely to misread risk and opportunity.
Granularity should go beyond city level whenever possible. Demand can vary by neighborhood, transit access, housing type, unit size, age of stock, and tenant or buyer segment. A downtown condo market may be soft while suburban family rentals remain extremely tight. Purpose-built rental may outperform investor-owned condo inventory because operating models and tenant profiles differ. Entry-level ownership may remain constrained while luxury product slows due to financing sensitivity. Good forecasting breaks the market into pieces that actually behave differently.
This is where geospatial analysis becomes valuable. Mapping household growth, commute patterns, school access, transit nodes, new construction, and rental vacancy can reveal demand clusters that are not obvious from citywide averages. The intelligence layer in modern real estate is increasingly spatial, not just numerical. Numbers tell you that demand exists. Spatial analysis tells you where and for whom.
Key indicators that reveal future housing demand
Not every data point matters equally. Some indicators are especially useful because they capture underlying pressure before it fully shows up in pricing or transaction data. Understanding these leading and coincident indicators is one of the fastest ways to improve forecasting quality.
Vacancy rate is one of the clearest signals. Low vacancy generally suggests that demand is outpacing available stock, particularly in rental markets. Rising vacancy can indicate softening demand, oversupply, or a mismatch between product and affordability. Importantly, vacancy is not just a supply metric. It is also a demand signal because it reveals whether the market is actually absorbing what exists.
Absorption rate is another critical measure. It shows how quickly newly available units are being leased or sold. Strong absorption suggests that the market has depth at current pricing and product specifications. Weak absorption may signal that pricing is too aggressive, the product type is misaligned, or competing supply is reducing urgency.
Household formation often matters more than population alone. Demand increases when people form independent households, not simply when a population total rises. Young adults moving out, new families forming, immigration-driven household expansion, and life-stage transitions all affect this metric. In uncertain affordability environments, household formation can slow or change form, pushing more people into shared housing or extended rental tenure.
Housing starts and completions show future supply pressure. They should always be interpreted together with vacancy and absorption. A surge in starts is not necessarily negative if household growth is strong and inventory remains tight. It becomes more concerning when completions are accelerating into a market where demand is already softening. Pipeline risk is essentially the forecasted collision between incoming supply and uncertain absorption.
Affordability should be treated as both a demand limiter and a demand shifter. Poor affordability may suppress ownership demand while strengthening rental demand. It may also redirect households geographically toward lower-cost municipalities or exurban areas. This is why affordability cannot be analyzed in isolation from migration and transportation patterns.
Interest rates and employment complete the picture. Rate changes affect borrowing power quickly, and labor market changes affect confidence and purchasing capacity. In many markets, the combination of easing rates and stable employment can unlock demand that has been delayed rather than destroyed. That distinction matters because delayed demand often returns faster than expected when financing conditions improve.

How scenario-based forecasting improves decision making
One of the most important shifts in real estate analytics is the move away from single-point forecasts toward scenario-based forecasting. In uncertain markets, one base-case prediction is often too fragile to be useful. CMHC’s 2025 Housing Market Outlook used three scenarios rather than only one, reflecting greater uncertainty in rates, policy, and macro conditions. That approach is worth adopting across private market analysis as well.
A scenario-based model asks a more realistic set of questions. What happens to demand if rates fall faster than expected? What happens if employment weakens but immigration remains high? What if completions surge while rent growth slows? Instead of pretending that the future will follow one exact path, scenario analysis maps a range of plausible outcomes and the conditions that would produce them.
This approach improves decision quality in two ways. First, it reduces overconfidence. Forecasts are not certainties, and the real estate market rarely moves in a perfectly linear way. Second, it helps organizations align strategy with risk tolerance. A conservative lender may focus on downside vacancy and absorption assumptions. A developer may test whether a project still performs under slower lease-up. An investor may compare best-case rental growth with downside refinance conditions.
Sensitivity analysis can deepen this work further. Rather than only building three broad scenarios, analysts can test how specific variables change outcomes. For example, what happens to demand if mortgage rates move by 50 basis points, or if vacancy rises by one percentage point, or if migration falls short of expectations? These exercises make models more actionable because they reveal which variables deserve the closest monitoring.
Forecasting best practice: The goal is not to be perfectly right about the future. The goal is to understand which outcomes are plausible, what signals will indicate change, and how decisions should adapt if conditions shift.
Where AI and modern analytics tools are changing forecasting
Artificial intelligence is beginning to improve demand forecasting, especially in short-term and high-frequency applications. Traditional housing datasets are still foundational, but they are often released with a lag. AI and machine learning models can help bridge that lag by identifying patterns in alternative datasets that update more frequently, such as listing activity, rent changes, search traffic, web engagement, mobility trends, and transaction timing.
For example, a forecasting system might detect that rental inquiries are rising in a neighborhood before official vacancy reports are published. It may identify that price reductions are becoming more common in one submarket while listing views remain strong in another. It may also cluster neighborhoods by behavioral similarity rather than by administrative boundary, revealing demand relationships that standard market reports miss.
That said, AI is not a shortcut around market logic. A model is only as useful as the data structure and assumptions behind it. If the inputs are noisy or unrepresentative, the output may look sophisticated while still being misleading. In real estate, explainability matters. Analysts need to understand why the forecast changed, which variables are driving it, and whether those signals align with known local conditions.
The most effective use of AI in real estate forecasting is as an intelligence layer rather than a replacement for human judgment. It helps surface anomalies, improve segmentation, accelerate nowcasting, and automate monitoring across multiple markets. Human analysts still need to interpret policy shifts, local planning issues, product positioning, financing structures, and on-the-ground demand behavior. The future of forecasting is not human versus machine. It is a better partnership between structured analytics and contextual expertise.
Common misconceptions that weaken demand forecasts
Several misconceptions repeatedly undermine real estate forecasting. The first is assuming that demand forecasting is just price prediction. Price is influenced by demand, but it is also shaped by supply conditions, financing constraints, policy, and seller behavior. A forecast that only estimates home prices misses much of the real decision-making value. Occupancy, absorption, renter or buyer intent, and segment-specific demand often tell a more useful story.
The second misconception is treating national data as sufficient. National housing trends provide macro context, but they can hide local oversupply, neighborhood-level demand resilience, or product-specific stress. Every serious forecast should move from broad market direction to location-specific validation.
The third is assuming that high demand automatically means a good investment. A market can show strong renter demand and still produce weak returns if acquisition costs, financing rates, taxes, insurance, or supply pipelines compress profitability. Demand is necessary, but not sufficient. Returns depend on how demand interacts with cost structure and timing.
The fourth misconception is seeing vacancy purely as a supply measure. In truth, vacancy is one of the best indicators of whether demand is keeping pace with available stock. It can reveal strain earlier than price data because landlords and sellers often adjust incentives before they adjust headline asking levels meaningfully.
The fifth and perhaps most important misconception is treating forecasts as if they are facts. Forecasts are conditional estimates built on assumptions. Rates, migration, employment, regulation, and sentiment can all change quickly. This is why scenario analysis is not optional in uncertain markets. It is a core part of responsible forecasting.
Applying demand forecasting to real decisions
To see how forecasting becomes practical, consider a multifamily investor evaluating two Canadian metro areas. National data suggests housing demand is soft overall, but local analysis shows that one city has low rental vacancy, strong in-migration, stable employment, and limited near-term completions. The other has similar recent rent growth but a much larger supply pipeline and signs of affordability fatigue. Without forecasting, both markets might look equally attractive. With forecasting, their risk profiles are clearly different.
Now consider a developer planning a condo launch. Historical sales data may look encouraging, but mortgage rates remain high enough to suppress first-time buyer conversion. Household growth is strong, yet the strongest unmet demand is actually in rentals due to ownership affordability barriers. A good forecast does not just say demand exists. It clarifies which form of demand is currently strongest and whether product strategy should change.
Lenders use forecasting in a similar way, though with a different emphasis. They need to assess whether future absorption and valuation assumptions are realistic under multiple scenarios. If units under construction are already elevated and local vacancy is beginning to rise, loan terms may need to reflect higher lease-up or sales risk. Forecasting allows those underwriting decisions to be made with more discipline.
Brokers and advisors can also create significant value through demand forecasting. Rather than relying on generic market commentary, they can help clients interpret local demand indicators, compare neighborhoods, estimate timing windows, and understand where buyer or tenant depth is likely to strengthen. In a crowded information environment, interpretation becomes the product.

A practical framework for building a demand forecast
For readers who want a structured approach, a demand forecast can be built in stages. The first stage is market definition. Decide whether you are forecasting at the country, metro, municipality, neighborhood, or asset level. Also define the housing type clearly, because ownership condos, purpose-built rental, student housing, and suburban single-family product each respond to different drivers.
The second stage is baseline data collection. Gather historical data on sales volume, rents, vacancy, starts, completions, inventory, days on market, mortgage rates, population growth, migration, employment, and affordability. If available, add localized data such as development applications, listing engagement, and lease-up trends for comparable properties. This creates the factual base of the model.
The third stage is driver analysis. Identify which variables appear most closely linked to demand in your chosen segment. In some markets, migration may dominate. In others, employment growth or financing conditions may explain more of the movement. This is where both statistical analysis and local knowledge matter. Correlation alone is not enough. The relationships must also make market sense.
The fourth stage is supply adjustment. Estimate what stock already exists, what is under construction, what is likely to complete, and how much of that future stock directly competes with your asset or strategy. Oversupply is often not a citywide phenomenon. It is a submarket or product-specific phenomenon. Forecasting must be specific enough to capture that.
The fifth stage is scenario design. Build at least three scenarios such as base, upside, and downside. Adjust rates, employment, migration, rent growth, and absorption assumptions accordingly. Then estimate outcomes such as occupancy, lease-up speed, sales velocity, or pricing resilience under each path. The goal is to understand the range, not just the midpoint.
The sixth stage is monitoring. A forecast should not be a static report that sits in a folder for six months. It should be updated as new data arrives. Dashboards are especially effective here because they let teams track leading indicators and revise assumptions quickly when market conditions shift. In a volatile environment, the speed of revision can be as valuable as the initial accuracy of the forecast.
What the current market teaches us about demand forecasting
The current North American housing environment offers several useful lessons. First, affordability pressure can suppress ownership demand while sustaining rental demand. That means analysts should be careful not to interpret weak home sales as universally weak housing demand. Some of that demand has simply shifted form. Second, interest rates remain one of the most powerful variables in the system, affecting both household behavior and developer feasibility. Third, supply pipelines need to be watched closely because markets can move from shortage to temporary imbalance faster than many expect.
Canada is a particularly strong case study in why granular forecasting is necessary. National demand may remain subdued, as CMHC’s 2026 outlook suggests, yet the country still faces a significant long-term housing supply challenge if it aims to return affordability to 2019 levels. Those two facts are not contradictory. They simply operate on different time horizons and at different levels of aggregation. Short-term demand softness can coexist with long-term structural undersupply.
That is exactly the type of nuance forecasting is built to capture. It allows decision makers to distinguish cyclical weakness from structural opportunity, and local resilience from broad-market fatigue. In a housing market full of headlines, that distinction is invaluable.
Conclusion: better forecasts lead to better real estate judgment
Demand forecasting in real estate is ultimately about making decisions with more context, more discipline, and less dependence on instinct alone. It combines population trends, migration, household formation, affordability, financing, vacancy, absorption, and supply pipelines into a working estimate of future market behavior. When done well, it helps investors avoid false signals, helps developers match product to real demand, helps lenders underwrite more responsibly, and helps advisors offer sharper guidance.
The most important takeaway is that demand forecasting is not about predicting a single number with perfect confidence. It is about understanding the conditions that drive housing demand, the local differences that shape outcomes, and the range of scenarios that could reasonably unfold. In today’s market, where national trends can hide local opportunity or local stress, that level of analytical clarity is no longer a luxury. It is part of the intelligence layer behind smart real estate decisions.
If the housing market feels more complex than it used to, that is because it is. But complexity does not have to lead to confusion. With the right data sources, a local lens, scenario-based thinking, and modern analytics tools, demand forecasting turns complexity into a framework. And in real estate, good frameworks lead to better judgment, more resilient strategies, and decisions that age well.



No Comment! Be the first one.