


Cities are full of movement. Every morning, commuters head to work, students travel to school, deliveries cross neighborhoods, buses follow packed corridors, and cyclists navigate routes that may or may not feel safe. At the surface, this looks like everyday urban life. Underneath it, however, is a complex system of patterns, tradeoffs, and infrastructure decisions that shape how efficiently a city works and how livable it feels. Mobility analytics is the intelligence layer that helps cities understand that system with greater precision.
Table Of Content
- What Mobility Analytics Actually Means
- The Data Behind Mobility Intelligence
- Why Mobility Analytics Matters for Transportation Efficiency
- Why Sustainable Urban Development Changes the Conversation
- What the Canadian Data Reveals About Urban Travel
- How Cities Use Mobility Analytics in Practice
- The Link Between Mobility Analytics and Better Commuter Experience
- Common Misconceptions About Mobility Analytics
- Privacy, Cybersecurity, and Governance Cannot Be Secondary
- Mobility Analytics as a Tool for Smarter Land Use
- The Future of Mobility Analytics in North American Cities
- Conclusion: Data Can Improve Travel, but Vision Shapes the Outcome
At its core, mobility analytics is the practice of collecting, integrating, and analyzing transportation related data to understand how people and goods move through urban areas. It brings together information such as traffic speeds, transit ridership, commuting patterns, origin destination flows, collision records, mobile location data, and sensor feeds. When these datasets are interpreted well, they can reveal where congestion builds, which neighborhoods are underserved, how commuting habits are changing, and where investment could make the biggest difference. In other words, mobility analytics turns fragmented movement data into actionable urban insight.
The most important point is that this field is about far more than moving cars faster. That older view is too narrow for modern cities, especially those trying to grow sustainably. Today, mobility analytics is increasingly used to improve accessibility, reduce emissions, strengthen public transit, support walking and cycling, improve safety, and align transportation planning with better land use decisions. For cities facing climate pressure, affordability challenges, and rising demand for better public space, this broader role matters enormously.
Canada provides a useful lens for understanding this shift. According to Statistics Canada, in 2021 about 11.0 million commuters used a car, truck, or van as their main commuting mode, representing 83.9 percent of commuters. By comparison, 1.0 million used public transit and 811,000 used active transportation. The average commute time was 23.7 minutes overall, including 22.8 minutes by car, 42.9 minutes by public transit, 12.5 minutes by walking, and 20.0 minutes by bicycle. These numbers tell a practical story about mode choice, infrastructure, and daily urban experience. They also show why cities need better tools to understand mobility behavior and improve it.
This article explores what mobility analytics is, how it works, why it matters for transportation efficiency, and why its biggest contribution may be in supporting sustainable urban development. The technology is important, but the larger value lies in the decisions it informs. Better transit priority, safer streets, more compact planning, improved accessibility, and lower transport emissions all depend on seeing the urban mobility system clearly. Mobility analytics helps cities do exactly that.
What Mobility Analytics Actually Means
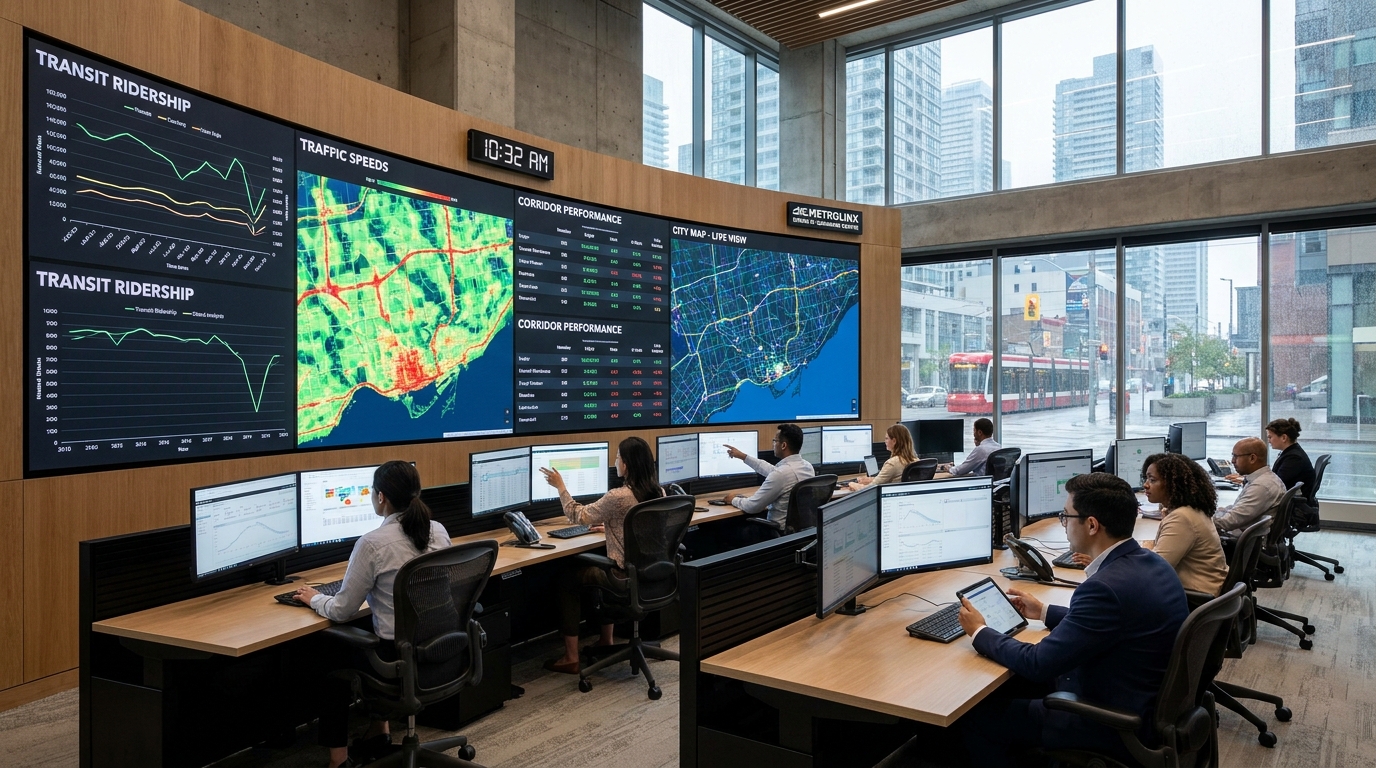
Mobility analytics can sound technical, but the basic concept is straightforward. Cities generate huge volumes of transportation related data every day, yet much of it sits in separate systems or is used in isolation. A transit agency may track ridership and on time performance. A transportation department may monitor traffic speeds and collisions. A planning department may study census commuting data and land use change. Mobility analytics brings these streams together so that decision makers can understand the whole picture instead of isolated fragments.
That integrated perspective matters because urban mobility is inherently interconnected. A delay on one arterial road can affect bus reliability. A new housing development can increase travel demand in one corridor while exposing the lack of nearby services in another. A protected bike lane can shift travel behavior, improve safety, and influence local street activity. Without analytics, these relationships are often addressed reactively. With analytics, cities can begin to anticipate them, test scenarios, and make better decisions earlier.
Transport Canada offers a useful framing by treating urban mobility as a person’s ability to move around the city where they live and work. That wording is subtle, but important. It places the focus on people and access, not simply on vehicle throughput. It also explains why indicators such as the travel time index and corridor level speed data are useful. They help cities evaluate how well transportation networks are performing in real conditions, and whether those conditions are improving or deteriorating over time.
In practice, mobility analytics often answers questions such as these: Where does congestion form consistently, and at what times? Which neighborhoods have limited access to jobs or services without a car? Where are collision hotspots clustering, and what design features are associated with them? How do weather, telework, or fuel prices alter commuting patterns? Which transit routes are overloaded, underused, or slowed by mixed traffic? These are not abstract questions. They are the practical foundation of better urban policy.
The Data Behind Mobility Intelligence
The power of mobility analytics depends on the range and quality of its inputs. Census and household survey data help establish baseline commuting patterns, demographic differences, and mode shares. GPS and mobile device data can show broader origin destination flows and how travel changes hour by hour or season by season. Transit smart card records reveal ridership patterns and transfer behavior, while traffic sensors and connected infrastructure provide real time speed and volume information.
Other data types are becoming more central as the field matures. Cities now use collision databases, curb activity records, freight movement data, parking occupancy information, and pedestrian or cycling counters to build a fuller picture of street performance. Some municipalities are also integrating environmental data such as emissions proxies, air quality measures, and heat exposure. When linked carefully, these datasets allow urban planners to move beyond traffic management and into a richer understanding of how transportation interacts with health, safety, equity, and climate outcomes.
Still, more data is not automatically better. A city can collect thousands of indicators and still fail to improve daily travel if governance is weak or priorities are unclear. The real value lies in asking the right questions, selecting meaningful metrics, and interpreting the findings in ways that align with public goals. Analytics is not a substitute for planning judgment. It is a powerful support system for it.
Why Mobility Analytics Matters for Transportation Efficiency
The most immediate value of mobility analytics is operational. Urban transportation systems are dynamic and often fragile. Congestion, collisions, weather disruptions, infrastructure work, and uneven demand can create delays that cascade across an entire network. With better data, agencies can identify these problems more quickly and respond more intelligently. This improves the efficiency of travel for commuters, transit riders, delivery operators, and city services alike.
One of the clearest examples is corridor monitoring. Transport Canada uses corridor level speed data and travel time indicators to understand how urban mobility performs across time and geography. This kind of monitoring helps reveal whether delays are temporary, structural, or linked to specific land use patterns. If one route consistently slows during school opening hours, for instance, the solution may involve intersection management, school street design, transit priority, or better walking infrastructure rather than simple road widening.
Transit systems also benefit significantly from analytics. Average commute time by public transit in Canada was 42.9 minutes in 2021, substantially longer than the average car commute. That gap matters because it shapes mode choice, equity, and the appeal of sustainable travel. Mobility analytics can identify where buses are losing time, where transfers fail, where crowding becomes a deterrent, and where schedule design does not reflect actual demand. When transit agencies use these insights well, they can improve reliability, reduce unnecessary delays, and make public transportation more competitive for everyday users.
Real time operations are another major area of value. Modern dashboards allow operators to watch changing travel conditions as they happen rather than relying only on periodic reports. That means agencies can manage incidents faster, adjust service, communicate disruptions more clearly, and deploy resources where they are needed most. In a growing city, this operational responsiveness can protect the efficiency of the network even before major capital upgrades are delivered.
Freight is part of this story too, though it is often overlooked in public discussions. Goods movement shapes urban life through deliveries, construction activity, retail supply, and logistics access. Mobility analytics can help cities understand truck routes, curb pressure, loading demand, and bottlenecks that affect economic productivity. Efficient freight planning does not only benefit business. It can reduce unnecessary circulation, lower emissions, and minimize conflict between commercial vehicles, cyclists, and pedestrians in dense areas.
Why Sustainable Urban Development Changes the Conversation
If transportation efficiency were the only goal, mobility analytics would still be useful. But sustainable urban development expands the conversation and makes the field more consequential. A city is not successful simply because vehicles move quickly. It is successful when people can access jobs, schools, healthcare, parks, and daily services safely, affordably, and with reasonable environmental impact. That distinction changes what cities measure and what they optimize for.
The World Health Organization emphasizes that transport is a major source of air pollution and a significant contributor to greenhouse gas emissions. This means mobility patterns are not just transportation issues. They are public health issues, climate issues, and quality of life issues. If a city uses analytics only to reduce vehicle delay without considering emissions or active travel, it can improve one metric while worsening broader urban outcomes. Sustainable mobility requires a more balanced framework.
UN Habitat offers one of the clearest principles here: sustainable urban mobility is fundamentally about accessibility, not simply moving more vehicles faster. In practical terms, that means planning cities so that people and destinations are closer together, and so that multiple modes can serve daily needs well. Mobility analytics supports this by showing where access is weak, where long commutes are concentrated, and where land use patterns force high car dependence. These insights can inform not only transportation projects, but zoning, density, public service location, and mixed use development strategy.
This is where mobility analytics becomes a true urban intelligence tool. It helps cities connect travel behavior to the structure of the city itself. If one district generates long, car dependent trips for basic errands, the problem may be spatial, not just operational. If another neighborhood has strong transit usage but poor last mile access, the answer may involve sidewalks, safer crossings, or cycling links. Sustainable development depends on diagnosing these relationships accurately, and analytics makes that diagnosis much stronger.
Mobility analytics is most valuable when it helps cities improve access, safety, and sustainability together rather than chasing speed in isolation.
What the Canadian Data Reveals About Urban Travel
Canada’s recent commuting data offers a grounded view of the transportation landscape. The fact that 83.9 percent of commuters mainly used a car, truck, or van in 2021 shows how dominant private vehicles remain in daily mobility. Public transit accounted for 7.7 percent of commuters, while active transportation represented 6.2 percent. These mode shares reflect infrastructure realities, land use patterns, transit quality, weather, urban form, and cultural habits. They also reveal how far many cities still have to go if they want to reduce car dependency in a meaningful way.
Commute times are equally instructive. The national average of 23.7 minutes may seem manageable at first glance, but the variation by mode tells a deeper story. Public transit users spent nearly twice as long commuting as drivers on average. Walking had the shortest average commute at 12.5 minutes, and cycling averaged 20.0 minutes. Those differences point to issues of network design, route directness, service frequency, and destination proximity.
There is also evidence that mobility behavior can shift quickly when broader conditions change. Toronto, Montréal, and Vancouver all recorded lower average commute times between 2016 and 2021, reflecting major travel behavior changes during the pandemic period, including telework. This is a crucial lesson for urban planners. Mobility systems are not static. They respond to policy, technology, economic conditions, and social behavior. Analytics helps cities measure those shifts rather than relying on outdated assumptions.
The post pandemic period makes this especially relevant. Hybrid work patterns, evolving downtown demand, partial transit recovery, and changing residential preferences have altered many urban travel flows. Cities that still plan from old commuting models risk investing in the wrong places or missing new opportunities. Those that use mobility analytics can spot emerging patterns sooner, adjust service more intelligently, and align infrastructure with how people are actually moving now.
How Cities Use Mobility Analytics in Practice
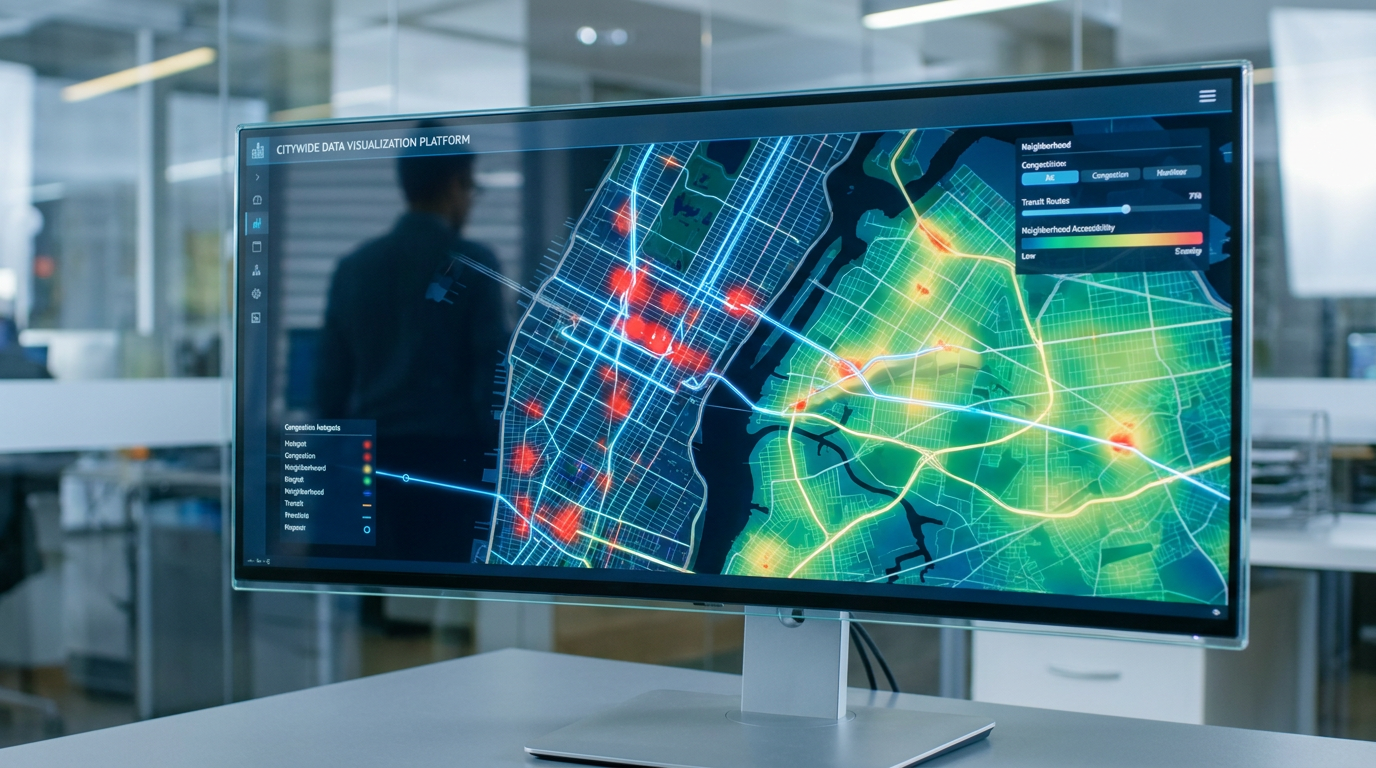
The practical applications of mobility analytics are becoming more visible across North America. Municipalities increasingly use data integration platforms, real time dashboards, and planning tools to connect traffic operations, safety analysis, and infrastructure planning. This shift reflects a broader move toward what could be called mobility intelligence, where multiple transportation datasets support one coherent decision workflow rather than isolated departmental reviews.
Toronto’s MOVE tool is a useful example. By centralizing collision and volume data, the platform supports more proactive mobility decisions. That kind of integration matters because safety issues and traffic patterns are deeply related, but historically they have often been assessed in separate silos. With a shared view, cities can identify where high volumes combine with severe safety risk, or where design changes may improve both flow and protection for vulnerable road users.
Transport Canada’s Canadian Urban Mobility 2.0 report points in a similar direction. It introduces a Municipal Mobility Index to assess how municipalities support sustainability, technology adoption, and the public good. That is significant because it expands mobility analysis beyond engineering performance into institutional readiness. A city may have good technology tools, but weak data governance. Another may have strong sustainability goals, but limited integration between planning and operations. Measuring readiness helps clarify where capability gaps still exist.
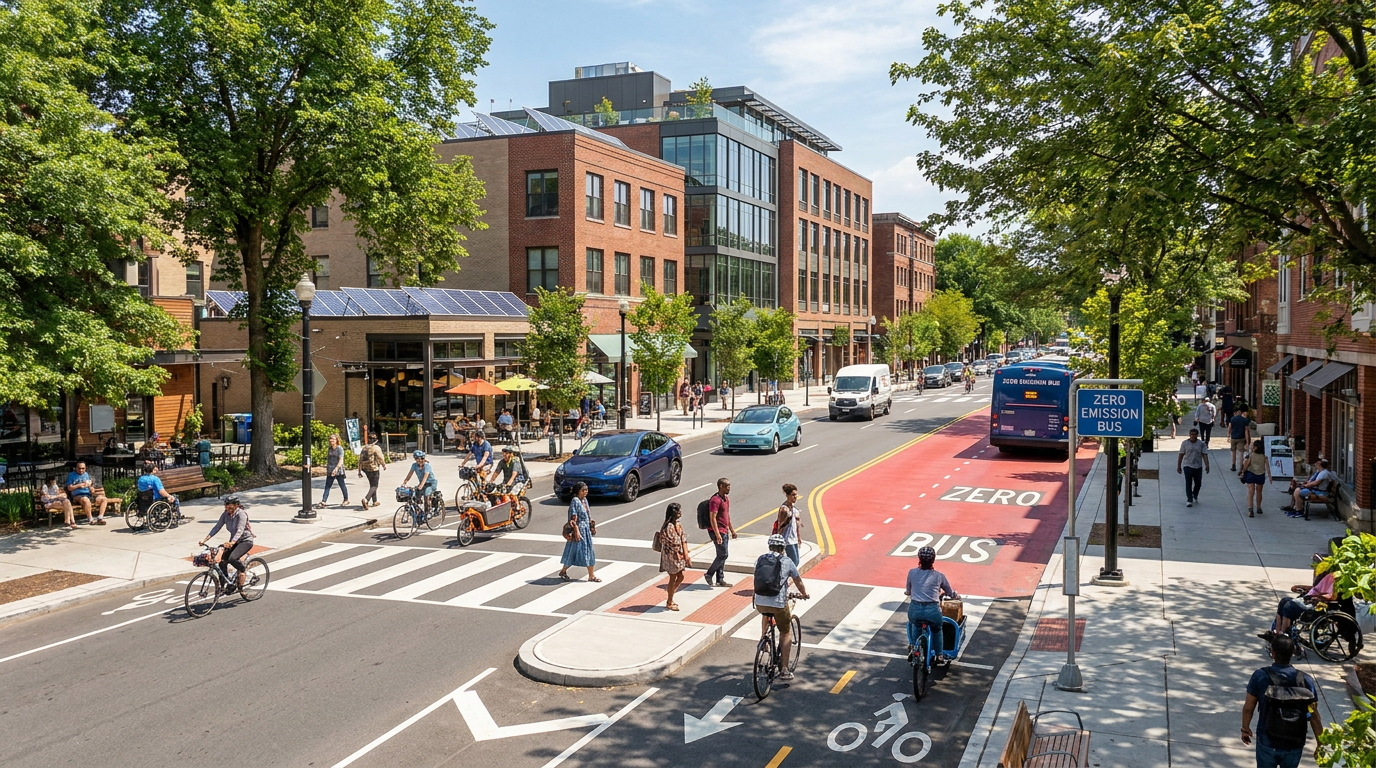
City use cases typically fall into a few broad categories. Agencies use analytics to monitor congestion and corridor performance, optimize signal timing, prioritize bus lanes, redesign dangerous intersections, and assess cycling network demand. They also use it to evaluate curb management, freight movements, accessibility gaps, and the likely effect of future development. Increasingly, they are applying these methods to climate adaptation and resilience questions as well, such as how heat, flooding, or extreme weather can disrupt mobility patterns.
For residents, the effect of this work is often indirect but meaningful. A more reliable bus arrival, a safer crossing, a better timed signal sequence, or a more accessible route to daily services all reflect data informed decisions somewhere in the system. The goal is not to create dashboards for their own sake. The goal is to improve real movement in real neighborhoods.
The Link Between Mobility Analytics and Better Commuter Experience
Urban transportation is experienced one trip at a time. For commuters, what matters is not an abstract model but whether the daily journey is predictable, safe, comfortable, and affordable. Mobility analytics improves this experience by identifying friction points that traditional planning can miss. It shows where delays are most harmful, where route options are limited, and where system performance diverges from what agencies believe is happening.
Reliability is often more valuable to commuters than absolute speed. A trip that consistently takes thirty minutes is easier to manage than one that usually takes twenty but sometimes takes fifty. Analytics helps agencies understand variability and not just averages. This is particularly important for bus riders, shift workers, caregivers, and lower income commuters whose schedules are less flexible and who may face larger consequences when transportation fails.
Accessibility is another major part of the commuter experience. A neighborhood may appear connected on a map but still have poor practical access if sidewalks are incomplete, crossings feel unsafe, or transit requires difficult transfers. Mobility analytics that includes pedestrian, cycling, and first last mile data can reveal these hidden barriers. That helps cities move beyond simplistic origin destination timing and toward a more realistic view of how usable the transport network actually is for different groups.
Equity should be central here. Better data can expose gaps that have long been normalized. Some communities face longer travel times, fewer reliable options, weaker transit frequency, or greater exposure to dangerous road conditions. When cities analyze mobility through an equity aware lens, they can prioritize investment where the burden of poor transportation is highest. That makes the commuter experience not only more efficient, but fairer.
Common Misconceptions About Mobility Analytics
As the field grows, it is often misunderstood. One common misconception is that mobility analytics is just sophisticated traffic counting. In reality, it includes safety, accessibility, emissions, multimodal travel behavior, freight, curb use, and land use relationships. Counting vehicles on a corridor may be part of it, but it is only one layer of a much broader intelligence system.
Another misconception is that the objective is always to make traffic move faster. In sustainable urban planning, that is often not the primary goal. A city may intentionally reallocate road space to bus lanes, bike lanes, wider sidewalks, or safer intersections even if that changes traffic speeds. If the result is better accessibility, lower emissions, fewer collisions, and stronger transit performance, that can be a superior outcome. Mobility analytics helps cities evaluate those tradeoffs with more clarity.
There is also a tendency to believe that dashboards solve problems by themselves. They do not. Data can reveal patterns, but better outcomes still depend on policy, funding, implementation capacity, and political judgment. A city can know exactly where bus priority is needed and still fail to deliver it if governance is weak or priorities are misaligned. Analytics is an enabler, not a substitute for action.
Finally, more data does not automatically produce better decisions. Poor data governance can create privacy risks, public distrust, and biased outcomes. If certain populations are underrepresented in data collection, the resulting picture of mobility can be incomplete or distorted. Cities need strong standards around transparency, interpretation, and public interest use if they want mobility analytics to deliver lasting value.
Privacy, Cybersecurity, and Governance Cannot Be Secondary
Responsible deployment is one of the most important parts of mobility analytics, especially as cities adopt richer and more granular data sources. Transportation related sensing can reveal highly sensitive information about people’s movements, routines, and places visited. Canada’s smart cities guidance has explicitly warned that mobility sensing may expose individuals’ movement patterns. That makes privacy design a foundational issue, not a technical afterthought.
Cities must decide what data they collect, how long they retain it, how it is anonymized, who can access it, and for what purposes it can be used. These choices shape public trust. If residents believe that movement data is being gathered without clear safeguards or public benefit, support for smart mobility projects can erode quickly. In contrast, strong governance frameworks make innovation more durable because they show that data use is accountable and proportionate.
Cybersecurity is part of the same conversation. As mobility systems become more connected, the risks associated with breaches, outages, or vendor vulnerabilities grow as well. A compromised mobility platform could affect operations, expose sensitive data, or disrupt public service. Cities therefore need procurement standards, auditing processes, interoperability strategies, and contingency planning. Smart infrastructure should not become brittle infrastructure.
Vendor dependence deserves attention too. Many municipalities rely on private platforms for analytics, sensors, mapping, or software integration. Those partnerships can be valuable, but they can also create lock in if data standards are closed or if local capability remains weak. Public agencies need enough internal knowledge to ask good questions, evaluate outputs critically, and ensure that mobility analytics remains aligned with the public interest rather than external commercial priorities alone.
Mobility Analytics as a Tool for Smarter Land Use
One of the most overlooked benefits of mobility analytics is its role in guiding land use decisions. Transportation and land use are inseparable. Where housing is built, where jobs concentrate, where schools and services locate, and how streets are designed all affect mobility outcomes. If planning decisions ignore transportation data, cities often end up locking in long commutes and high car dependence for decades.
Analytics can show which neighborhoods have poor access to employment within a reasonable travel time, which growth areas lack transit support, and where daily needs are too dispersed to be served efficiently. These insights help planners think beyond road capacity and toward urban form. In many cases, the best mobility intervention is not a larger road. It is a more connected neighborhood, a better mix of uses, or a denser corridor that supports frequent transit.
This is where concepts such as transit oriented development and accessibility planning become especially relevant. By combining mobility data with land use forecasts, cities can identify where housing growth would be best supported by existing transit and where infrastructure should be upgraded before growth accelerates. That kind of sequencing matters. When development and mobility planning are aligned, cities can become more efficient, more affordable, and more sustainable at the same time.
From a sustainability standpoint, this may be the deepest value of the field. Mobility analytics helps cities ask not just how people move today, but what kind of city structure will support better movement tomorrow. That is a long horizon question, and it is exactly where urban intelligence is most needed.
The Future of Mobility Analytics in North American Cities
The field is still evolving. Canada continues to build the data infrastructure behind mobility analytics through more granular commuting updates, corridor level performance monitoring, and expanded transportation data hubs. Researchers and public agencies are also using newer data types such as origin destination flows, mobile device derived mobility patterns, and city scale models to understand decarbonization pathways and behavior change more clearly. This suggests that mobility analytics will become both more sophisticated and more central to urban decision making over the next decade.
At the same time, the policy environment is changing. Climate targets are sharpening, urban populations are growing, and municipalities are under pressure to improve affordability and resilience while managing limited budgets. That means transportation investments will face more scrutiny. Cities will need to show not only that a project moves people efficiently, but that it contributes to emissions reduction, safety, accessibility, and broader quality of life goals. Analytics can support that evidence base, provided it is used thoughtfully.
The rise of integrated urban intelligence platforms is likely to continue. More municipalities will combine mobility, safety, environmental, and land use data into shared dashboards and planning workflows. There will also be growing interest in scenario modeling, where cities test the likely effects of new transit lines, zoning changes, curb regulations, or street redesigns before implementation. Done well, this can reduce risk and improve public decision quality.
Still, the future of mobility analytics should not be defined by technology alone. The strongest systems will be those that remain grounded in human outcomes. Faster processing, richer datasets, and cleaner dashboards are useful only if they help create safer streets, shorter and more reliable commutes, healthier neighborhoods, and more equitable access to opportunity. The measure of success is not how much data a city has. It is what the city does with it.
Conclusion: Data Can Improve Travel, but Vision Shapes the Outcome
Mobility analytics is transforming urban travel because it gives cities a clearer, more dynamic understanding of how movement actually works. It helps transportation agencies monitor corridors, improve transit performance, respond to real time conditions, and identify where infrastructure is failing users. For commuters, that can mean more reliable trips, better access, safer streets, and a less frustrating daily experience. For planners and policymakers, it offers a stronger evidence base for long term decisions.
Yet its larger significance lies in sustainable urban development. By connecting travel behavior to emissions, public health, safety, equity, and land use, mobility analytics helps cities shift from narrow traffic management toward a more complete vision of urban accessibility. It supports the idea that successful mobility is not about moving more vehicles through space. It is about helping more people reach what they need in ways that are efficient, safe, and environmentally responsible.
The Canadian evidence underscores both the challenge and the opportunity. Heavy reliance on cars, large differences in commute times by mode, and changing post pandemic travel behavior all point to the need for smarter planning. Tools such as corridor monitoring, municipal mobility indexes, and integrated safety platforms show that the foundations are being built. But better data alone will not create better cities. Cities still need policy courage, strong governance, privacy safeguards, and investment in transit, walking, cycling, and better urban form.
That is the real promise of mobility analytics. It is not a magic solution, and it is not just a dashboard discipline. It is a decision framework that can help cities become more efficient and more sustainable at the same time. When used with care and ambition, it can turn urban movement data into something far more valuable: a smarter path toward healthier, more accessible, and more livable cities.



No Comment! Be the first one.