



Construction has always involved uncertainty. A project can look well planned on paper, then lose time because of weather, absorb unexpected cost because of material lead times, or face disruption because a design clarification arrives too late. For decades, many teams managed that uncertainty with experience, static spreadsheets, and periodic reviews. Those tools still have value, but they are no longer enough on their own when projects are larger, supply chains are less predictable, and performance pressure is higher than ever.
Table Of Content
- Why risk analytics matters more now
- What risk analytics in construction actually means
- The main risk categories analytics can improve
- Schedule risk
- Cost risk
- Safety risk
- Procurement and supply chain risk
- Quality and rework risk
- Contract and claims risk
- How risk analytics works across the project lifecycle
- Preconstruction
- Design and coordination
- Procurement and mobilization
- Active construction
- Commissioning and handover
- Concrete examples of advanced risk analytics in action
- Example 1: Highway construction using weather and traffic analytics
- Example 2: Commercial building schedule drift through workflow signals
- Example 3: Safety analytics guiding supervision intensity
- Example 4: Asset and maintenance risk through digital twin thinking
- Leading indicators, lagging indicators, and why the difference matters
- The growing role of AI in construction risk analytics
- What a mature construction risk analytics program looks like
- Common misconceptions that hold teams back
- How to start using risk analytics more effectively
- The strategic payoff: protecting margin, schedule, and trust
- Final thoughts
Risk analytics in construction is the discipline that helps close that gap. It uses data, structured risk processes, statistical methods, and increasingly AI-enabled tools to identify where a project is vulnerable before the damage becomes visible in the field or on the monthly report. Instead of treating risk as a checklist completed at the start of a job, analytics turns it into a continuous decision system. Teams can monitor trends in schedule performance, procurement volatility, safety observations, contract activity, weather exposure, and labor productivity, then act on early warnings with far more precision.
That shift matters because the most expensive construction failures rarely appear all at once. They tend to build gradually through missed handoffs, accumulating delays, unresolved RFIs, slow submittal cycles, rising rework, supplier instability, or repeated near misses. Risk analytics helps reveal those patterns while there is still time to respond. It does not remove uncertainty from construction, because no method can do that, but it can reduce surprise. In this industry, reducing surprise often protects margin, schedule credibility, client trust, and worker safety at the same time.
This article explores how advanced risk analytics transforms construction project management through concrete examples and practical applications. It also explains why the strongest risk programs are not defined by software alone. They are built on clean data, a clear risk taxonomy, leading and lagging indicators, disciplined governance, and action thresholds that turn insight into response.
In construction, the goal of risk analytics is not perfect prediction. The goal is earlier visibility, better prioritization, and faster intervention.
Why risk analytics matters more now
Construction teams today operate in a tighter and more interconnected environment than they did even a few years ago. A labor shortage in one trade can affect sequencing across the entire project. A procurement delay can trigger rescheduling, additional supervision costs, claims pressure, and downstream quality issues. Severe weather can alter not just site conditions, but transportation reliability, crew allocation, and concrete or paving windows. What makes these problems difficult is not simply that they exist, but that they interact.
North American construction is especially exposed to these compounding risks. Projects often involve long durations, multiple subcontractors, climate variability, remote logistics, strict compliance demands, and heavy dependence on outside suppliers. Many firms also manage several projects at once, which means a problem on one site can spill into labor availability or equipment planning on another. When risks are interconnected, isolated tracking methods are too slow and too narrow. Analytics provides the integrated view needed to understand the chain reaction.
Safety alone shows why a more disciplined, data-driven approach is necessary. In 2024, federally regulated Canadian employers reported 42,910 work-related injuries, including 18,877 disabling injuries and 74 fatal injuries. Those figures are not construction only, but they underscore the stakes for high-risk sectors where moving equipment, changing site conditions, and tight schedules already create exposure. Risk analytics helps organizations look beyond injury counts and examine leading indicators such as inspection completion, hazard closure times, training compliance, and near-miss reporting. That is where prevention becomes practical rather than aspirational.
The industry is also seeing a major technological shift. AI-assisted estimating, project controls, compliance tools, and safety platforms are gaining attention because firms want better forecasting and earlier warnings. Yet the most useful framing is not that AI replaces experienced builders. It is that AI can scan larger data sets faster, detect weak signals that humans may miss, and support the people who still make the critical decisions. The future of risk management is augmentation, not automation for its own sake.
What risk analytics in construction actually means
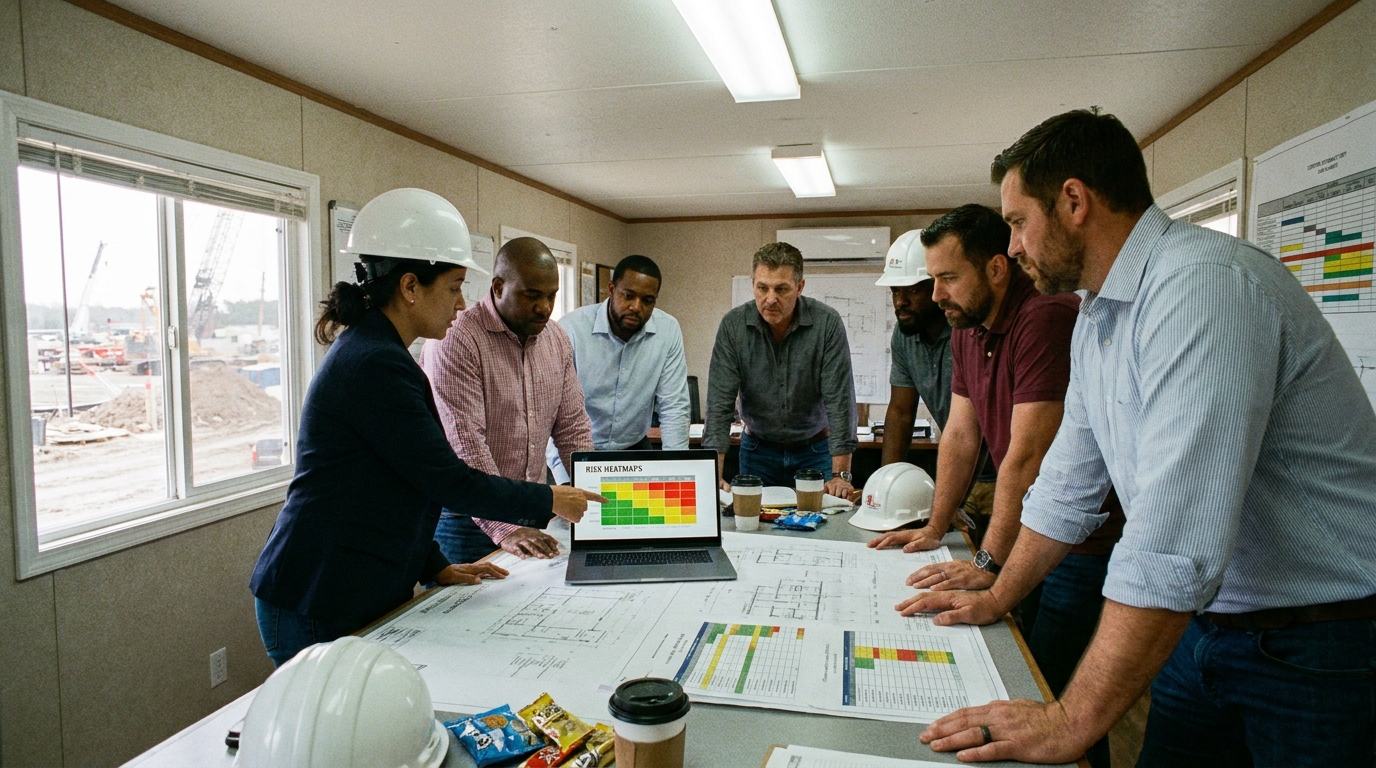
Risk analytics is sometimes misunderstood as a new label for a traditional risk register. A risk register still matters, but by itself it is only a partial tool. Mature risk analytics connects the register to live or regularly updated project data so that risk is measured, prioritized, monitored, and escalated based on evidence. In other words, it moves from qualitative discussion toward operational intelligence.
The core framework remains consistent with ISO 31000:2018, which was reviewed and confirmed in 2023. The process includes identifying, analyzing, evaluating, treating, monitoring, and communicating risk. In construction, that framework becomes much more powerful when linked to schedule systems, cost tracking, procurement data, field reporting, contract workflows, and safety systems. A risk item is no longer just a note saying material delays are possible. It becomes a monitored exposure supported by supplier performance history, current lead-time variability, open purchase status, and schedule sensitivity.
Canadian Centre for Occupational Health and Safety guidance reinforces another important point. Risk assessment should fit the task, available data, team experience, and level of detail required, and it should be continuously reviewed. That means analytics should match project complexity. A small tenant improvement may not need the same model depth as a hospital, a bridge replacement, or a multi-phase industrial facility. Effective programs are calibrated. They are not one-size-fits-all scoring exercises.
It also helps to think of risk analytics as an operating model rather than a software category. Organizations gain the most value when they create a shared risk language across departments, define thresholds for action, improve data quality, and establish governance around who responds to what signal. Without those conditions, dashboards can become visually impressive but operationally weak. With them, the same dashboard becomes a management tool that changes site behavior and executive decisions.
The main risk categories analytics can improve
Construction risk is broader than safety, even though safety deserves special attention. The most effective analytics programs usually organize risk into categories that reflect how projects actually fail. This structure helps teams compare issues, assign ownership, and track whether mitigation actions are working.
Schedule risk
Schedule risk is often the most visible project problem because clients, lenders, owners, and subcontractors all feel the impact of time slippage quickly. Analytics can reveal critical-path fragility, repeated activity underperformance, poor trade handoffs, and trends in delayed approvals. Monte Carlo schedule simulation can also help teams understand the probability of completion dates rather than relying only on deterministic schedules that assume everything proceeds exactly as planned.
One practical example is using RFI turnaround times and submittal approval durations as predictive signals. If those cycles begin to lengthen in a structurally important package, schedule drift may already be forming even before the baseline schedule shows an obvious delay. Teams that monitor these indicators can increase design coordination effort, escalate client decisions sooner, or resequence work while options still exist.
Cost risk
Cost overruns rarely come from a single dramatic event. More often, they emerge from cumulative issues such as estimate bias, incomplete scope assumptions, labor inefficiency, procurement price movement, and change-order growth. Risk analytics can compare estimate assumptions to historical project outcomes, identify cost-risk hotspots by work package, and flag spending patterns that indicate potential erosion of contingency.
This is especially useful during preconstruction. Estimators can test how volatile categories such as steel, mechanical equipment, electrical gear, or concrete supply behaved on similar past projects. Instead of assigning contingency uniformly, teams can place it where uncertainty is highest. That approach creates a more honest budget conversation and gives leadership clearer visibility into where margin is at risk.
Safety risk
Safety analytics is strongest when it combines lagging indicators with leading indicators. Incident rates and recordable injuries are important, but they tell you what has already happened. Leading indicators, such as inspection completion, unresolved hazards, training compliance, toolbox talk participation, and near-miss reports, help reveal exposure before harm occurs. Construction sites change daily, so a static safety view is inherently limited.
Analytics can also identify concentration risk. If a certain crew, shift, zone, or activity consistently shows delayed hazard closure or reduced inspection performance, supervision can be adjusted before incident probability rises. That is a more targeted and effective response than waiting for an injury trend to emerge.
Procurement and supply chain risk
Procurement is now one of the most consequential risk areas in construction. Long lead times, supplier concentration, shipping disruption, fabrication quality issues, and customs or transportation variability can all affect schedule reliability. Analytics helps teams compare vendors, monitor expected versus actual lead times, and understand which delayed items have the greatest schedule sensitivity.
Projects involving roadwork, heavy vehicles, and logistics planning also need to account for transportation-related exposures. National collision statistics and route constraints matter when moving equipment and materials to site. A procurement issue is not only about whether a product ships on time. It is also about whether it can be delivered safely and predictably into the project sequence.
Quality and rework risk
Quality defects can destroy productivity quietly because they trigger re-inspection, demolition, replacement work, and relationship strain. Risk analytics can track nonconformance patterns by trade, area, supplier, drawing revision history, and inspection type. If a specific package consistently generates repeat deficiencies, the issue may point to supervision gaps, unclear design information, rushed installation, or weak vendor quality controls.
When quality data is connected to schedule and cost data, teams can calculate the real operational impact of rework. That often changes how seriously recurring defects are treated. A quality problem is no longer seen as isolated field noise. It becomes a measurable driver of labor waste and schedule exposure.
Contract and claims risk
Construction disputes often begin long before anyone uses the word claim. They start with incomplete documentation, repeated scope ambiguity, delayed approvals, inconsistent notices, or unresolved change exposure. Risk analytics can monitor contract-heavy workflows such as pending changes, rejected claims, RFI themes, approval bottlenecks, and owner response times. This helps teams identify where project records are becoming fragile.
Claims avoidance is one of the most valuable but least discussed uses of analytics. Early pattern detection allows project managers to strengthen records, escalate unresolved issues, and align legal, commercial, and operational teams before disputes harden. That protects both cash flow and relationships.
How risk analytics works across the project lifecycle
One of the clearest lessons from standards such as ISO 13824 is that structured risk assessment belongs across the full lifecycle of a structure. In construction, risk does not begin when the first crew arrives on site and it does not end at substantial completion. Analytics creates the most value when it supports planning, design, procurement, construction, commissioning, handover, maintenance thinking, and even decommissioning where relevant.
Preconstruction
Preconstruction is where many of the highest-leverage decisions are made. Budget strategy, schedule logic, bid package structure, supplier approach, site logistics, and contingency planning all shape how resilient a project will be later. Risk analytics at this stage can compare proposed assumptions against historical outcomes from similar jobs. It can reveal where estimates are optimistic, where lead times are unstable, and which activities are likely to become schedule bottlenecks.
For example, a commercial builder planning a high-rise may review prior data showing that curtain wall approvals and elevator procurement repeatedly delayed dry-in on similar projects. That insight allows earlier design coordination, more realistic float planning, and procurement strategies that reduce downstream pressure. Without analytics, those lessons may remain trapped in individual memories instead of guiding the next project systematically.
Design and coordination
During design, risk often appears as ambiguity, incomplete coordination, scope growth, or approval delay. BIM-based coordination and digital review tools can help surface clashes, but analytics adds another layer by measuring how design decisions affect schedule and cost exposure over time. If certain disciplines generate unusually high RFI volumes or repeated revisions, that trend can be treated as a project risk rather than simple administrative inconvenience.
Design risk matters because unresolved questions tend to migrate into the field where they are more expensive. The earlier teams can identify instability in drawings, specifications, or owner decision cycles, the better they can protect sequencing and avoid rushed work.
Procurement and mobilization
As the project moves into purchasing and mobilization, the priority shifts toward material availability, supplier reliability, transportation planning, and the alignment between planned and actual site readiness. Analytics can score items by both lead-time volatility and schedule criticality. That distinction is essential because not every delayed item has the same consequence.
A generator may have a long lead time but sit late in the schedule, while a switchgear package may have less lead-time uncertainty but much greater impact if it slips. Analytics helps teams focus attention where consequence is highest, not just where noise is loudest.
Active construction
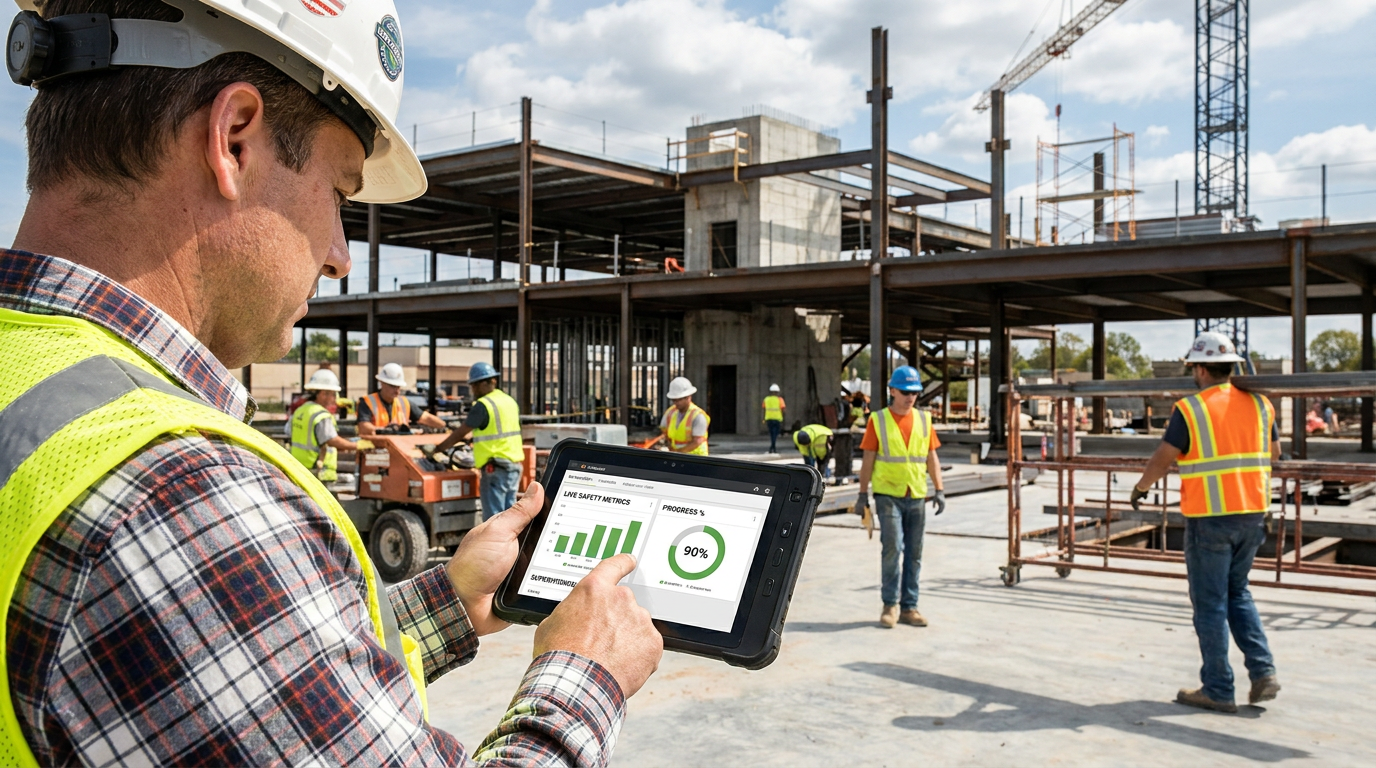
During construction, risk analytics becomes a live control mechanism. Progress updates, labor production, field observations, inspection outcomes, equipment usage, weather conditions, and safety reporting can all feed a current picture of exposure. This is where AI-assisted systems can be particularly useful because they can scan more variables more quickly than manual review allows.
Imagine a superintendent receiving an alert that a certain floor zone has falling inspection completion, increasing rework notices, and compressed trade overlap at the same time. None of those indicators alone guarantees a major problem, but together they suggest elevated risk. The response could include added supervision, sequence adjustment, or targeted quality checks. The value lies in intervention before the weekly report confirms slippage.
Commissioning and handover
Late-stage risk is often underestimated because teams are eager to finish. Yet commissioning delays, documentation gaps, incomplete testing, unresolved deficiencies, and training shortfalls can extend occupancy dates and weaken owner confidence. Analytics can track closure rates, deficiency recurrence, and readiness indicators so that handover becomes a managed process instead of a scramble.
This lifecycle perspective is important because many project failures are not rooted in one dramatic mistake. They develop through transitions between phases, where information is lost, assumptions are not updated, and accountability becomes blurred. Analytics makes those transitions more visible and measurable.
Concrete examples of advanced risk analytics in action
The best way to understand risk analytics is to see how it applies in real project contexts. The methods may sound technical, but their value is practical. They help teams make better timing decisions, allocate resources more intelligently, and escalate issues before they become expensive.
Example 1: Highway construction using weather and traffic analytics
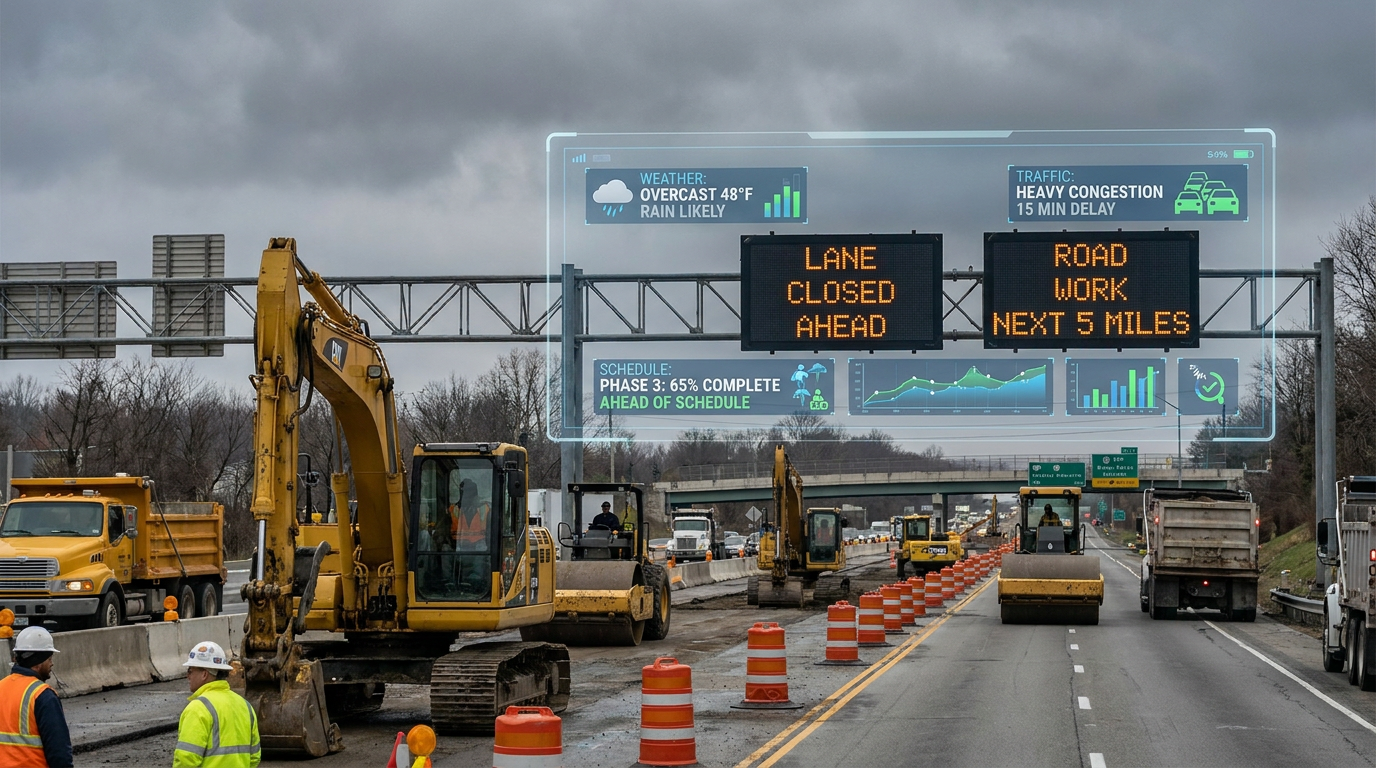
A highway contractor planning concrete pours and lane closures faces both physical and logistical risk. Weather affects curing conditions, worker safety, and equipment efficiency. Traffic volume affects closure windows, public disruption, and the likelihood that a minor delay becomes a major operational problem. By combining historical weather patterns, short-term forecasts, traffic data, and production rates, the contractor can identify more reliable windows for critical activities.
If the analytics show rising probability of rainfall during planned paving days and higher weekend congestion due to a local event, the team can re-sequence work, secure alternate closure timing, or stage materials differently. That decision may protect both schedule and public safety. It also reduces the chance of costly rework caused by poor environmental conditions.
Example 2: Commercial building schedule drift through workflow signals
A general contractor on a large office development may not see obvious schedule delay in the baseline update until the slippage is already significant. However, workflow analytics might show that RFI turnaround times have increased by 25 percent, submittal approvals are slowing, and unresolved change requests are clustering in one mechanical area. Together, those are early signals of coordination strain and probable schedule drift.
With that visibility, the project manager can add coordination meetings, elevate decision requirements to the owner, and prioritize issue resolution in the affected package. The intervention is modest compared with the cost of recovering a full late-stage delay. This is exactly where analytics creates value. It turns administrative patterns into operational foresight.
Example 3: Safety analytics guiding supervision intensity
A civil contractor may collect daily pre-task plans, inspection logs, near-miss reports, training data, and equipment utilization records. If analytics shows that a specific workfront has high overtime, reduced inspection completion, and slower hazard closure than the rest of the site, leadership can treat that area as needing stronger supervision. They may rotate experienced foremen, reduce congestion, or adjust shift structure.
This is a more intelligent use of safety data than waiting for incident rates to worsen. It also recognizes that safety risk often rises under production pressure, fatigue, and coordination complexity. The analytics does not replace field judgment. It sharpens it.
Example 4: Asset and maintenance risk through digital twin thinking
For infrastructure owners and long-life facilities, risk analytics extends beyond project delivery into asset performance. Sensor data, inspection histories, maintenance records, and digital twin models can reveal where structural condition or system performance is degrading faster than expected. That supports better maintenance timing, more credible capital planning, and reduced probability of sudden service disruption.
This matters because lifecycle risk is increasingly central to modern construction intelligence. Building something on time is important, but building something that can be monitored, maintained, and managed intelligently over its useful life is even more valuable.
Leading indicators, lagging indicators, and why the difference matters
Many construction organizations still rely too heavily on lagging indicators. These are measures that describe outcomes after the fact, such as injury rates, completed delays, cost overruns, or defect counts. They are useful for accountability and learning, but weak for prevention when used alone. If a dashboard only reports what has already gone wrong, it is not functioning as an early warning system.
Leading indicators provide the forward-looking signals that risk analytics needs. In safety, they can include inspection completion, hazard closure time, training compliance, and near-miss participation. In schedule control, they can include submittal cycle time, RFI aging, percent of planned work completed, or trade handoff readiness. In procurement, they can include supplier responsiveness, manufacturing milestone adherence, and freight reliability.
The real power comes from combining both types. Lagging indicators validate whether risk treatment is working over time. Leading indicators show where teams should focus before failure becomes visible. That balance aligns closely with guidance from occupational health and safety practice, and it is one of the clearest markers of a mature risk program.
The growing role of AI in construction risk analytics
AI is now part of the construction risk conversation because project data volume has grown beyond what many teams can process manually. Schedules contain thousands of activities. Procurement systems track multiple vendors and status changes. Field platforms collect photos, observations, inspections, and notes every day. Contracts and change records add another layer of complexity. AI can help connect these data streams, detect patterns, and surface exceptions quickly.
That said, AI should be approached with discipline. Industry discussion increasingly emphasizes not just possibility, but governance, data accuracy, and security. If source data is inconsistent, fragmented, or poorly classified, even sophisticated models can produce misleading outputs. More data is not automatically better data. Better-structured data is what creates reliable intelligence.
The strongest use case for AI is decision support. It can prioritize alerts, summarize emerging issues, forecast likely problem zones, or identify correlations that deserve human review. It cannot carry contractual accountability, substitute for field leadership, or understand project nuance in the way an experienced builder can. The practical future is a hybrid model where human expertise and machine-assisted pattern detection reinforce each other.
AI in construction risk management works best when it augments judgment, not when it pretends to replace it.
What a mature construction risk analytics program looks like
Companies that benefit most from risk analytics tend to build a few foundational capabilities well. They maintain cleaner historical project data. They define risk categories consistently across projects. They connect risk tracking to project controls, procurement, quality, and safety systems. They also establish ownership, escalation paths, and thresholds that tell teams when to act.
A mature program often includes several integrated elements:
- A shared risk taxonomy so schedule, cost, safety, procurement, quality, and contract risks are classified consistently.
- Historical benchmarking to compare current assumptions with outcomes from similar projects.
- Leading and lagging indicators that give both predictive visibility and outcome measurement.
- Action thresholds that define when a signal triggers review, escalation, or intervention.
- Data governance to improve accuracy, ownership, security, and trust in the analytics.
- Executive and field alignment so dashboards drive decisions rather than sit unused.
Notice that none of these elements depends only on buying software. Tools matter, but they succeed only when the operating discipline around them is clear. Many organizations already have enough data to start improving risk visibility. The challenge is often integration, consistency, and follow-through.
Common misconceptions that hold teams back
Several misconceptions prevent construction firms from getting value out of risk analytics. One is the belief that risk management is mainly about safety. Safety is critical, but risk also includes cost, schedule, quality, procurement, environment, reputation, and contractual exposure. A project can be physically safe and still fail commercially.
Another misconception is that qualitative scoring alone is enough. A simple red-yellow-green matrix can be useful for communication, but it becomes weak when disconnected from actual project signals. Mature risk analytics adds evidence, trend analysis, thresholds, and workflows. It turns discussion into management.
Some teams also assume that analytics is a one-time preconstruction exercise. In reality, risk changes as the project moves through design, procurement, execution, and closeout. New suppliers enter the picture. Weather shifts. Client priorities evolve. Crews change. A static assessment quickly becomes stale.
Finally, there is the belief that adopting AI or a dashboard means the problem is solved. It is not. Poor-quality or fragmented data can make analytics misleading. Governance, training, and process discipline remain essential. Technology is only as useful as the decisions it enables.
How to start using risk analytics more effectively
For organizations looking to improve, the best approach is usually practical rather than overly ambitious. Start by identifying the few project risks that consistently hurt performance, such as delayed approvals, change-order growth, labor productivity swings, or recurring safety observations. Then determine which data sources already exist to measure those risks more objectively.
From there, build a modest but integrated framework. Define the risk categories. Choose a set of leading and lagging indicators. Establish reporting cadence and action thresholds. Make sure project managers, superintendents, estimators, and executives see the same logic. This common structure matters as much as the dashboard itself because it creates alignment around what deserves attention.
As confidence grows, teams can expand into scenario planning, probabilistic schedule analysis, supplier scoring, digital twin monitoring, or AI-assisted forecasting. The key is to improve decision quality step by step. The most effective programs are rarely flashy at first. They are reliable, consistent, and increasingly embedded in daily project operations.
The strategic payoff: protecting margin, schedule, and trust
Construction risk analytics ultimately delivers value because it helps organizations protect what matters most. Better forecasting protects margin by reducing avoidable overruns and rework. Earlier visibility protects schedule by enabling intervention before recovery becomes costly. Stronger leading indicators protect people by supporting prevention instead of reaction. Cleaner documentation and workflow insight protect relationships by reducing the chance of dispute.
There is also a broader strategic benefit. In a market shaped by labor shortages, weather volatility, insurance pressure, and supply chain variability, firms that understand risk more clearly are more competitive. They bid with better realism, execute with stronger control, and communicate with clients more credibly. Risk analytics becomes not just a defensive discipline, but a performance advantage.
That is why the most useful way to think about this field is simple. Risk analytics does not eliminate uncertainty from construction. It makes uncertainty more measurable, more visible, and more manageable. In a business where so many failures begin as weak signals, that capability can change the future of a project long before the final numbers are known.
Final thoughts
Construction will never be risk free, and no dashboard can promise perfect outcomes. But the industry no longer has to depend mainly on hindsight and instinct when warning signs are already present in project data. With structured methods, integrated systems, and disciplined leadership, risk analytics gives teams a better chance to see what is coming and respond while options remain open.
For owners, contractors, and project leaders across Canada and North America, that is the real promise of advanced construction intelligence. It is not about replacing people with software. It is about giving experienced people a stronger evidence base for timely decisions. In practical terms, that means fewer surprises, safer jobsites, better schedule control, and a stronger chance that the project finishes as intended.
When construction organizations embrace risk analytics as an operating model rather than a reporting exercise, they move from reacting to problems toward managing probability. That shift may sound subtle, but on real projects it can be the difference between a profitable outcome and a troubled one.



No Comment! Be the first one.