



Money decisions used to depend heavily on instinct, habit, and occasional advice from a banker, planner, or relative who seemed good with numbers. Today, financial choices are increasingly shaped by something more precise: wealth analytics. At its core, wealth analytics means using data, technology, and structured analysis to understand your financial position more clearly and make better decisions from that understanding. It is not reserved for hedge funds or ultra high net worth households. The same logic now appears in budgeting apps, investment dashboards, retirement calculators, banking alerts, and planning software used by ordinary consumers every day.
Table Of Content
- What Wealth Analytics Actually Means
- Why Data Driven Finance Matters More Than Ever
- The Core Building Blocks of Wealth Analytics
- Budgeting Tools: The Entry Point for Most Households
- What to Look for in a Budgeting Analytics Tool
- Net Worth Tracking: Seeing the Full Financial Picture
- Investment Analytics: Moving Beyond Basic Returns
- Risk Tolerance Versus Risk Capacity
- Forecasting and Scenario Planning
- Debt Analytics: Understanding the Cost of Borrowing
- Behavioral Analytics: The Human Layer Behind the Numbers
- Dashboards and Financial Aggregation Platforms
- Artificial Intelligence in Wealth Analytics
- How to Use Wealth Analytics in Everyday Financial Decisions
- Common Mistakes People Make With Financial Analytics
- Choosing the Right Wealth Analytics Tools for Your Needs
- The Future of Wealth Analytics
- Conclusion: Better Financial Decisions Start With Better Signals
That shift matters because modern financial life is complicated. Income can come from multiple sources, expenses can fluctuate week to week, debt can sit across cards, loans, and subscriptions, and investments may be spread across retirement accounts, brokerage platforms, and cash products. Most people do not struggle because they lack access to information. They struggle because they have too much disconnected information and too little clarity. Wealth analytics helps organize those signals into a system that is easier to read and act on.
This article breaks down the major tools and methods behind wealth analytics in accessible terms. Rather than treating analytics as abstract financial jargon, we will look at how it works in practical settings such as building a household budget, assessing investment risk, forecasting cash flow, preparing for retirement, and spotting weak points in your financial plan before they become expensive. The goal is simple: to show how data driven insight can improve everyday financial decisions without making personal finance feel robotic or overwhelming.
When used well, wealth analytics does not replace judgment. It strengthens it. It gives context to your goals, reveals patterns in your behavior, and helps you compare choices with more confidence. In an economy where interest rates shift, market conditions change quickly, and costs rarely stay still, that kind of clarity is no longer a luxury. It is becoming a basic advantage.
What Wealth Analytics Actually Means
Wealth analytics is the process of collecting financial data, organizing it, and applying tools that help interpret what the numbers are saying. That may include tracking income and spending, measuring net worth, evaluating debt loads, assessing portfolio performance, estimating future liabilities, and modeling scenarios such as job loss, rising expenses, or different retirement timelines. The purpose is not only to know your numbers but to understand the relationships between them.
For example, someone may believe they are saving well because their account balance grows each month. An analytics platform may reveal a more nuanced story: savings are increasing, but irregular spending spikes are eroding annual progress, and a large percentage of wealth remains in low yield cash while high interest debt continues to accrue. That kind of insight changes the decision. Instead of celebrating a growing balance alone, the person can optimize cash allocation, reduce interest drag, and improve long term outcomes.
Wealth analytics draws from several disciplines, including personal finance, data analysis, behavioral economics, and financial planning. Some tools are descriptive, meaning they show what has already happened. Others are diagnostic, explaining why a financial trend appeared. More advanced systems are predictive, estimating what may happen next, while some are prescriptive, recommending an action such as rebalancing a portfolio or increasing emergency reserves. In simple terms, analytics moves from reporting to interpretation to action.
The phrase can sound technical, but many consumers already use it without calling it that. If you have ever reviewed a spending chart from your bank, received a low balance alert, compared your investment return to a benchmark, or used a retirement calculator to test future savings rates, you have already interacted with wealth analytics. The difference is that a broader wealth analytics mindset connects those tools into one decision framework.
Why Data Driven Finance Matters More Than Ever
Financial decisions have become more sensitive to timing and precision. A small difference in mortgage rates can change borrowing costs dramatically over time. A modest increase in living expenses can alter your savings runway. Delaying debt repayment or retirement contributions by a few years can create a significant opportunity cost. In this environment, broad advice such as spend less or invest consistently remains useful, but it is often not specific enough. Better decisions come from understanding your own numbers in context.
Data driven finance helps cut through emotional noise. People often overreact to market drops, underestimate recurring expenses, and overestimate future discipline. Analytics can expose those biases with evidence. If your dashboard shows that entertainment and dining are consistently 18 percent above target, that is more actionable than a vague sense that spending feels high. If your portfolio tracker reveals that a handful of tech stocks now dominate your holdings, that tells you concentration risk may be building even if your returns look strong.
This is especially important because financial health is not a single metric. A high income does not guarantee liquidity. Strong investment gains do not always compensate for weak tax planning. A large emergency fund can coexist with an undisciplined spending pattern. Wealth analytics brings together multiple indicators such as cash flow, savings rate, debt service ratio, asset allocation, volatility, and projected liabilities so you can evaluate your finances as an integrated system rather than a collection of isolated balances.
There is also a practical efficiency benefit. Instead of manually checking accounts, downloading spreadsheets, and guessing which metric deserves attention, a well designed analytics setup can prioritize the few signals that matter most. That may be a sudden change in monthly burn rate, a drift in portfolio allocation, or a missed contribution to a goal based account. In other words, wealth analytics does not only improve accuracy. It improves focus.
The Core Building Blocks of Wealth Analytics
To understand the tools, it helps to understand the inputs. Wealth analytics usually begins with four categories of data: income, expenses, assets, and liabilities. Income includes salary, freelance work, rental revenue, dividends, and other inflows. Expenses cover fixed costs such as rent and insurance as well as variable costs such as groceries, fuel, and entertainment. Assets include cash, investments, property, and retirement accounts, while liabilities include credit cards, student loans, auto loans, mortgages, and any other debt obligations.
From there, analytics platforms calculate metrics that matter. Net worth measures assets minus liabilities. Cash flow shows how much money comes in versus how much goes out over a period. Savings rate tracks the percentage of income being set aside. Debt to income ratio compares obligations to earnings. Investment performance evaluates returns, often adjusted for risk or benchmark comparisons. Goal based metrics estimate whether current behavior is sufficient to fund a future objective such as a home purchase, education, or retirement.
Good analytics also depends on data quality. If transactions are miscoded, account balances are outdated, or assets are missing, the insights can become distorted. That is why many tools rely on automated account syncing and categorization. Even then, users often need to review categories, rename merchants, and confirm whether a payment belongs to housing, travel, or debt service. Analytics is only as reliable as the underlying structure.
Another foundational concept is time horizon. Some metrics matter daily, such as cash balances and payment due dates. Others should be reviewed monthly, such as spending trends and savings progress. Portfolio risk and retirement forecasts may deserve quarterly or annual attention. One of the most useful habits in wealth analytics is matching the metric to the decision frequency, so you do not micromanage long term data or ignore short term warning signs.
Budgeting Tools: The Entry Point for Most Households
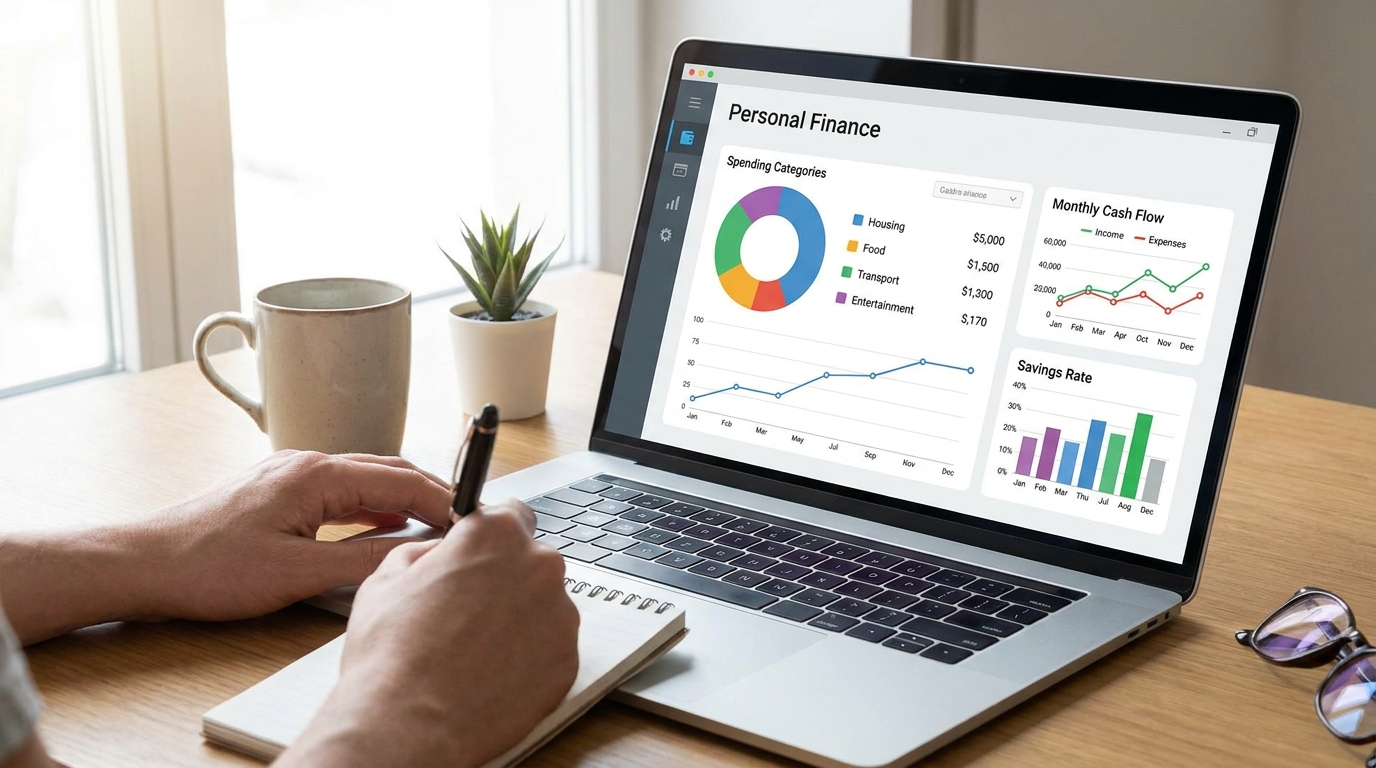
For many people, wealth analytics begins with budgeting software. This is often the most accessible layer because it turns transaction data into a visible pattern. Instead of seeing money leave your account one purchase at a time, budgeting dashboards show categories, trends, and deviations from plan. That shift from transaction level awareness to pattern recognition is where analytics starts to become powerful.
Modern budgeting tools can categorize spending automatically, compare current activity with prior months, and highlight recurring charges that might otherwise be forgotten. Some tools also estimate your baseline spending, identify periods of unusually high outflow, and separate essential from discretionary expenses. These are not just convenience features. They help answer more meaningful questions, such as whether a spending increase is temporary, seasonal, or structural.
One practical application is understanding cash flow stability. A household may appear financially healthy because annual income is strong, yet still experience monthly stress because expenses and obligations cluster around certain dates. A cash flow dashboard can show whether bill timing creates preventable shortages, whether emergency reserves are doing their job, and whether transferring part of income into designated accounts would reduce friction. This is analytics serving behavior, not just measurement.
Budgeting tools are also useful because they reveal hidden drift. Small subscriptions, convenience purchases, and irregular one off expenses can slowly redefine your normal spending level. Without data, that shift is easy to miss. With a dashboard, it becomes visible. You can compare current discretionary spending with six month averages, identify categories growing faster than income, and decide whether your spending still reflects your priorities.
Good budgeting is not about restricting every purchase. It is about knowing what your money is already doing so you can decide what it should do next.
What to Look for in a Budgeting Analytics Tool
The best tool is not necessarily the most advanced one. It is the one that presents the right amount of information clearly enough for you to act on it. In practical terms, that means a strong budgeting analytics tool should offer account aggregation, automatic transaction categorization, customizable categories, monthly trend views, and simple visualizations for cash flow and savings progress. If the system is difficult to maintain, people stop using it, and the value disappears.
Some users benefit from additional features like bill tracking, goal based savings buckets, or alerts for unusual transactions. Others prefer a simpler dashboard with fewer moving parts. The key is that the tool should help you answer real questions. Can I afford this purchase? Is my spending aligned with my goals? Am I building reserves fast enough? Which categories create the most pressure? When software can answer those questions consistently, it becomes a useful intelligence layer rather than another app competing for attention.
Net Worth Tracking: Seeing the Full Financial Picture
Budgeting explains movement. Net worth tracking explains position. A person can have positive cash flow and still be losing ground if liabilities are growing faster than assets. Conversely, someone may feel financially stagnant because cash is tight each month, yet still be making substantial progress through retirement contributions and mortgage principal reduction. Net worth analytics puts those forces in one frame.
Tracking net worth over time can be surprisingly clarifying because it turns financial progress into a measurable trend. Instead of focusing only on salary or account balances, you can see whether your total financial position is strengthening. That matters because wealth is usually built through accumulation and debt management over long periods, not through one isolated action. A net worth chart can reveal the slope of progress and whether that slope is improving.
This form of analytics also helps with prioritization. If liabilities are the main constraint, accelerating debt payoff may produce a better outcome than increasing taxable investments. If a large share of assets is tied up in one property or one employer stock position, your risk exposure may be higher than it appears from balances alone. Net worth tracking does not solve those issues by itself, but it shows where they are.
For households that own real estate, net worth tools become even more relevant. Home equity, mortgage balance, cash reserves, and investment accounts should be considered together. It is common for people to feel asset rich but cash constrained, particularly if too much wealth is concentrated in property. Wealth analytics helps distinguish between balance sheet strength and day to day flexibility.
Investment Analytics: Moving Beyond Basic Returns
One of the most misunderstood areas of personal finance is investment performance. Many people look only at whether a portfolio is up or down, but wealth analytics asks deeper questions. Up compared with what? At what level of risk? With how much concentration? Over what time frame? And is the current portfolio still aligned with the investor’s goals, liquidity needs, and tolerance for volatility?
Investment analytics tools usually track asset allocation, historical performance, benchmark comparison, dividend income, fees, and tax exposure. More advanced platforms can estimate drawdown risk, show factor exposure, and test how the portfolio might respond to inflation, recession, or interest rate shifts. While not every retail investor needs institutional level modeling, even basic analytics can improve decision quality significantly.

Consider a simple example. Two portfolios both earned 8 percent over the past year. On the surface, they seem equally successful. But one achieved that result with broad diversification and moderate volatility, while the other depended heavily on a single high growth sector. Wealth analytics can expose that difference. It helps investors understand not only return but the structure of return. That distinction matters because concentrated gains can reverse quickly.
Analytics also improves behavior during market stress. When markets fall, investors often feel pressure to react immediately. A dashboard that shows long term allocation targets, historical volatility ranges, and projected goal outcomes can provide context that reduces panic driven decisions. Data cannot remove uncertainty, but it can make uncertainty easier to interpret. In practice, that may mean fewer emotional trades and more disciplined rebalancing.
Risk Tolerance Versus Risk Capacity
One of the most valuable contributions of investment analytics is separating risk tolerance from risk capacity. Risk tolerance is psychological. It reflects how comfortable you feel when markets fluctuate. Risk capacity is structural. It reflects how much financial risk your situation can absorb based on your age, time horizon, income stability, emergency reserves, and future obligations. These two measures do not always align.
A younger investor with stable earnings and decades before retirement may have high risk capacity, even if market drops feel uncomfortable. A near retiree with major upcoming withdrawals may have lower risk capacity, even if they believe they can handle volatility. Analytics can quantify these differences by linking portfolio behavior to real life funding needs. That is far more useful than relying on generic investor personality quizzes alone.
Forecasting and Scenario Planning
Forecasting is where wealth analytics becomes especially strategic. Instead of describing the past, forecasting uses current data and assumptions to estimate future outcomes. That may involve projecting savings balances, retirement income, debt payoff dates, tax obligations, college funding, or expected spending under different inflation scenarios. These models are not perfect predictions. They are structured ways to test whether your current path is plausible.
The power of scenario planning lies in comparison. You can ask what happens if you save 10 percent versus 15 percent of income. You can model how a mortgage refinance changes cash flow over five years. You can test whether retiring at 62 versus 67 creates a funding gap. You can estimate the impact of a market downturn in the first years of retirement. When these alternatives are visualized clearly, financial planning becomes less abstract and more decision ready.
Even simple forecasting can be useful for households outside traditional investing conversations. A freelancer might model irregular income seasons and build a reserve target based on expected gaps. A family planning a move can compare housing costs, commuting expenses, childcare, and tax differences across neighborhoods. Someone considering a career change can estimate how long existing savings will last under reduced income. In each case, analytics supports planning by turning uncertainty into bounded possibilities.
It is important, however, to remember that forecasts depend on assumptions. Inflation, returns, wages, healthcare costs, and taxes can all shift. The smartest use of forecasting is not treating one output as truth. It is using models as living tools that should be updated as your circumstances change. In that sense, forecasting is less about prediction than preparation.
Debt Analytics: Understanding the Cost of Borrowing
Debt is often discussed emotionally, but analytics brings needed precision. Not all debt carries the same urgency. A low rate mortgage behaves differently from revolving credit card balances. Fixed student loans differ from variable business debt. Wealth analytics helps compare balances, rates, repayment timelines, and monthly obligations in a way that supports rational prioritization.
One of the most useful debt metrics is the effective cost of delay. This shows what it means in practical terms to postpone repayment. High interest consumer debt can compound quickly, making delay expensive. A debt dashboard can calculate how much interest accrues monthly, how long repayment will take at current rates, and how much a modest increase in payments would save over time. These numbers often have more behavioral impact than generic advice to pay debt faster.
Analytics can also support strategic choices between saving and repayment. For example, someone deciding whether to allocate extra cash toward investments or debt reduction needs to compare expected investment returns, debt interest rates, liquidity needs, and risk tolerance. There is no universal answer. Wealth analytics helps make the tradeoff visible instead of ideological. That is particularly helpful when balancing emergency reserves against accelerated debt payoff.
For households with multiple obligations, visualization matters. Seeing loan balances, rates, and payoff progress in one interface can reduce cognitive burden and make the plan feel more manageable. It is easier to stay committed when progress is visible and when each payment clearly moves the system in a better direction.
Behavioral Analytics: The Human Layer Behind the Numbers
One reason wealth analytics is so valuable is that it captures patterns humans routinely miss. Financial behavior is not perfectly logical. People anchor to outdated budgets, ignore gradual lifestyle inflation, delay tasks that feel unpleasant, and interpret good short term outcomes as evidence of a good long term strategy. Behavioral analytics helps surface those tendencies by identifying repeated actions and their consequences.
Some platforms now track habits such as savings consistency, frequency of overdraft risk, timing of bill payments, spending spikes after payday, or changes in investment behavior during volatile periods. These are not trivial observations. They reveal the routines driving financial outcomes. If your savings transfers repeatedly fail near the end of the month, the issue may be timing rather than discipline. If spending rises after every bonus, the issue may be a weak allocation plan rather than insufficient income.
Analytics becomes most useful when it turns behavior into feedback loops. That means connecting observed patterns to practical interventions. A dashboard might suggest moving due dates, automating transfers earlier, capping discretionary categories after a threshold, or creating alerts when a specific merchant category exceeds normal levels. This is where financial intelligence becomes personal. The tool is no longer just reporting. It is helping design a better system around your actual habits.
The strongest financial plans are not built around ideal behavior. They are built around observed behavior, then improved with better structure.
Dashboards and Financial Aggregation Platforms
Most wealth analytics experiences rely on dashboards that pull data from multiple accounts into one place. This aggregation is more important than it seems. Without it, people often optimize one account while ignoring the broader system. They may hold excess cash in checking, maintain expensive card debt, and invest aggressively in a retirement account without seeing how these pieces interact. A unified dashboard allows smarter coordination.
Effective dashboards usually include net worth, account balances, spending, upcoming obligations, savings goals, debt status, and investment allocation. Better ones also allow filtering by time period, category, or household member. The visual design matters because finance can become overwhelming when too many charts compete for attention. A strong dashboard highlights priority metrics and exceptions rather than drowning users in every possible data point.
Security is a central concern here. Since aggregation often requires linking bank and brokerage accounts, users should evaluate encryption standards, account permissions, privacy policies, and whether the service sells or shares user data for marketing. Financial clarity should not come at the cost of weak data stewardship. Trust is part of the product.
For general audiences, the real value of dashboards is that they create continuity. You can move from a spending alert to a savings goal, from a debt payoff plan to a portfolio review, without switching mental models. That continuity supports better decision making because you can see tradeoffs in one place. A financial choice is rarely isolated. Dashboards help keep that reality visible.
Artificial Intelligence in Wealth Analytics
Artificial intelligence is increasingly shaping wealth analytics, though often in quieter ways than the headlines suggest. In many consumer tools, AI helps categorize transactions, identify anomalies, generate spending insights, forecast trends, and personalize recommendations. In investment platforms, it may support portfolio monitoring, tax loss harvesting signals, or rule based rebalancing suggestions. The most practical benefit is not flashy automation. It is faster interpretation of complex data.
For everyday users, AI can reduce friction by answering questions in natural language. Instead of navigating layers of menus, someone may ask why spending rose this month, how much they can safely transfer to savings, or what would happen if they increased retirement contributions by 2 percent. This kind of conversational analytics can make financial tools feel more accessible, especially for users who find traditional dashboards intimidating.
Still, AI should be treated as an assistant, not an unquestioned authority. Recommendations depend on the quality of the data, the assumptions built into the model, and the boundaries of what the system can see. If an AI tool lacks information about upcoming medical costs, family support obligations, or planned career changes, its output may be incomplete. Good financial judgment still requires context.
The best use of AI in wealth analytics is to improve speed, pattern detection, and personalization while keeping users in control. When it helps summarize the important signals, compare scenarios, and explain tradeoffs clearly, it creates value. When it encourages blind trust, it creates risk. In finance, intelligence should increase transparency, not reduce it.
How to Use Wealth Analytics in Everyday Financial Decisions
The practical question is how all of this translates into daily life. In reality, wealth analytics is most effective when tied to recurring decisions rather than occasional financial checkups. A household can use spending analytics to set a realistic monthly target based on actual history rather than aspirational guesses. It can use cash flow projections to decide whether a vacation should be funded now or deferred by two months. It can use debt analytics to determine whether a tax refund should be split between a loan payment and an emergency fund.
Investment decisions benefit in similar ways. Rather than adding money to whichever fund feels familiar, an investor can review allocation drift, tax exposure, and concentration risk first. Someone planning a large purchase can use net worth and liquidity analytics to avoid becoming asset rich but cash poor. A self employed worker can use seasonal income trends to define reserve thresholds and automate transfers during high earning months. Each decision becomes more grounded because it is tied to evidence instead of mood.
There is also a meaningful communication benefit for couples and families. Shared dashboards can reduce vague disagreements about money by replacing them with observable numbers and clearer tradeoffs. Instead of arguing over whether spending is too high, partners can look at category trends. Instead of debating whether retirement savings are adequate, they can review a projection together. Analytics does not remove emotion from financial conversations, but it gives those conversations a more stable reference point.

The key is to avoid turning analytics into passive observation. The goal is not to admire dashboards. The goal is to use them to trigger better actions. Review spending, adjust transfers, rebalance allocations, update goals, revisit assumptions, and refine the system. Wealth analytics creates value when insight becomes behavior.
Common Mistakes People Make With Financial Analytics
One common mistake is tracking too many metrics without knowing which ones actually matter. Financial tools can produce dozens of charts, but most households only need a focused set of indicators to make better decisions. Cash flow, savings rate, debt burden, net worth trend, and portfolio allocation are often enough to create a strong baseline. When everything looks equally important, nothing receives proper attention.
Another mistake is relying on stale assumptions. A retirement model built three years ago may no longer reflect income, inflation, housing costs, or family obligations. Budget targets set before a move or job change may quietly become irrelevant. Analytics requires maintenance. If the inputs are outdated, the outputs lose credibility. The discipline is not only in checking the dashboard but in refreshing the assumptions behind it.
People also tend to confuse visualization with strategy. A beautiful app does not guarantee a good financial plan. The underlying logic still matters. Are your goals realistic? Are you holding enough liquidity? Are you paying too much in fees or interest? Are you overexposed to one asset class? Wealth analytics should sharpen strategic thinking, not distract from it with attractive charts.
Finally, some users become overly reactive. Daily fluctuations in investment balances or weekly spending swings can create noise that leads to unnecessary decisions. Good analytics should increase signal, not anxiety. That is why matching review frequency to the nature of the metric is so important. Not every change deserves action.
Choosing the Right Wealth Analytics Tools for Your Needs
The right setup depends on complexity, confidence, and goals. Someone at an early stage of financial organization may need a simple budgeting and net worth tracker. A more advanced user might want investment analytics, tax estimation, and scenario planning features. The mistake is assuming that more complexity always leads to better outcomes. In practice, the best toolset is one you understand well enough to use consistently.
When evaluating options, consider usability, account integration, security practices, reporting quality, customization, and whether the platform helps turn insight into action. If you cannot quickly tell what changed, why it changed, and what to do next, the tool may not be serving you well. It should reduce friction, not create another management task.
It can also help to think in layers. One layer covers day to day cash flow and spending. Another covers wealth position through net worth and debt. A third covers investing and long term planning. Some all in one tools handle all three reasonably well, while others do one area exceptionally and connect with separate services. There is no universal template. What matters is building a system that gives you coherent visibility across your financial life.
The Future of Wealth Analytics
Wealth analytics is moving toward more personalization, automation, and real time guidance. Instead of static monthly reports, users increasingly expect live dashboards, predictive alerts, and recommendations tailored to their income patterns, obligations, and goals. Open banking frameworks and better data connectivity are making it easier for tools to see a fuller financial picture. AI will likely deepen this shift by improving interpretation and communication.
At the same time, the human need remains the same. People want confidence, control, and clarity. They want to know whether they are making progress, whether a major decision is affordable, and what tradeoffs they are accepting when they choose one path over another. Technology can support those goals, but only if it remains understandable. The future winners in this space will not be the platforms with the most features. They will be the ones that turn complexity into useful judgment.
That is why wealth analytics matters beyond finance enthusiasts. As households face changing rates, rising costs, uneven income patterns, and longer planning horizons, financial intelligence becomes part of everyday resilience. Better tools do not eliminate uncertainty. They make it easier to navigate with evidence.
Conclusion: Better Financial Decisions Start With Better Signals
Wealth analytics is not about becoming obsessed with numbers. It is about using numbers to reduce blind spots. Whether you are trying to control spending, build savings, manage debt, invest more intelligently, or plan for retirement, analytics gives structure to decisions that are otherwise easy to approach emotionally or inconsistently. It replaces guesswork with signals and turns scattered financial data into a more coherent map.
For a general audience, that should feel encouraging rather than intimidating. You do not need institutional software or advanced modeling expertise to benefit. Start with visibility. Understand cash flow, track net worth, review debt costs, and use simple forecasting for upcoming goals. As confidence grows, the tools can become more sophisticated. The principle remains the same: better data, interpreted well, supports better decisions.
In personal finance, clarity compounds just like money does. The sooner you understand the patterns shaping your financial life, the sooner you can adjust them with intention. Wealth analytics is simply the toolkit for doing that more intelligently.



No Comment! Be the first one.