



Most homeowners already live with more data than they realize. Every utility bill, thermostat setting, grocery receipt, appliance label, and monthly budget update tells a story about how a home performs. Household analytics is the process of collecting those signals, organizing them, and using them to make better decisions. It is not only for engineers, smart home hobbyists, or spreadsheet enthusiasts. At its best, it is a practical way to improve comfort, control costs, and create a home that works better for everyday life.
Table Of Content
- What household analytics actually means
- Why energy is the best place to start
- The core tools that make household analytics accessible
- Utility bills and billing history
- Smart meters and utility dashboards
- Smart thermostats
- Appliance labels and product efficiency data
- Budgeting apps and spending dashboards
- How to build a simple household analytics system
- A beginner friendly framework
- Turning data into better living decisions
- Common use cases every homeowner should know
- Finding the most expensive appliance to run
- Measuring whether upgrades actually save money
- Reducing standby power and small recurring waste
- Improving affordability under cost pressure
- Misconceptions that can lead homeowners in the wrong direction
- How to compare products and programs more intelligently
- A practical 30 day plan for getting started
- The future of household analytics
- Final thoughts
The idea is simple. Instead of guessing why bills are rising or why one room always feels too cold, you use information to identify patterns. You track where energy goes, which devices consume the most, how household spending shifts over time, and whether upgrades actually deliver savings. Once you can see the pattern, you can test changes with more confidence. That might mean adjusting heating schedules, replacing an aging appliance, cutting standby power, or simply timing energy use more strategically.
This matters because the largest household costs are becoming harder to ignore. Statistics Canada reported average homeowner shelter spending of $27,831 in 2023, up 17.4% from 2021. Energy, maintenance, and operating costs sit inside that broader financial picture. At the same time, utility platforms, smart meters, connected thermostats, and budgeting tools are making data more accessible to ordinary households. Household analytics is quickly becoming a decision layer for better living, not just a convenience feature.
For beginners, the good news is that you do not need a fully automated smart home to get started. A year of utility bills, a thermostat app, appliance efficiency labels, and a simple monthly budget are enough to begin. The goal is not perfect measurement. The goal is useful insight. In this guide, we will break down what household analytics means, which tools matter most, and how homeowners can use data in a realistic, low stress way to make the home more efficient, affordable, and comfortable.
What household analytics actually means
Household analytics refers to the collection and interpretation of data from inside and around the home to improve comfort, efficiency, cost control, and sustainability. That may sound technical, but the core concept is familiar. If you compare winter heating bills year to year, you are already doing a basic form of analytics. If you notice that your energy use spikes every weekday afternoon, that is another form. The difference today is that digital tools can make these signals easier to capture, visualize, and act on.
There are several major categories of household data. Energy data includes electricity, natural gas, heating oil, propane, and sometimes water use depending on your utility setup. Financial data includes household spending by category, recurring subscriptions, repair costs, and shelter related expenses. Equipment data includes appliance age, maintenance history, efficiency ratings, and run time. Environmental data can include indoor temperature, humidity, air quality, and outdoor weather conditions. Together, these inputs give homeowners a fuller view of performance.
What makes household analytics useful is not the volume of data but the ability to connect one metric to a decision. A thermostat trend can help you decide whether your heating schedule is too aggressive. A budget dashboard can reveal whether utility inflation is crowding out other priorities. A smart plug can identify a device using more standby power than expected. Good analytics narrows attention to the most important question: what should I change first?
Household analytics is not about turning your home into a laboratory. It is about making ordinary decisions with better evidence.
That shift from observation to action is where the value appears. Public agencies in Canada and the United States increasingly frame household energy tools this way. Natural Resources Canada highlights smart thermostats, EnerGuide, and ENERGY STAR labeling as ways for households to monitor consumption and make better purchase decisions. The U.S. Department of Energy and the Energy Information Administration similarly point to smart meters, home energy management systems, and end use breakdowns as practical tools for understanding where energy is going.
Why energy is the best place to start
If you are new to household analytics, energy is the clearest starting point because it is measurable, recurring, and often expensive. It also produces fast feedback. Most homeowners can see changes on monthly bills, and those with smart meters or connected devices may be able to view hourly or daily usage trends. This makes energy data especially useful for testing whether a change actually worked.
The biggest reason to start here is scale. In Canada, Natural Resources Canada notes that space heating and cooling represent almost two thirds of home energy use. In the United States, the EIA reports that more than half of household annual energy consumption is tied to space heating and air conditioning. That means HVAC is usually the highest value target for analytics. If a homeowner wants the largest practical return from better data, heating and cooling is usually where the answer begins.
Fuel type also matters. In the U.S., 42% of households reported electricity as their main space heating fuel in 2024, while 47% used natural gas. That means household analytics should never focus only on electricity. Some homes may have electric resistance heating, others may rely on gas furnaces, heat pumps, oil systems, or hybrid setups. To understand the true performance of a home, homeowners need to look at all the energy flows that matter in their specific property.
Even before making upgrades, data can answer basic questions that save money. Is the thermostat set too high overnight in winter or too low in summer? Does a home use energy heavily during unoccupied hours? Is a room constantly triggering longer heating cycles because of poor insulation or air leakage? Are seasonal spikes consistent with weather, or do they suggest an equipment issue? These are beginner level questions, but they can lead to meaningful savings.
The core tools that make household analytics accessible
Household analytics sounds advanced, but the most useful tools are now designed for everyday users. You do not need to buy everything at once. In fact, the smartest approach is to begin with the tools that answer a specific question. If the main concern is high heating bills, start with a thermostat or utility dashboard. If the problem is broad spending pressure, begin with household budgeting data and bill review. Each tool becomes more valuable when paired with a clear purpose.
Utility bills and billing history
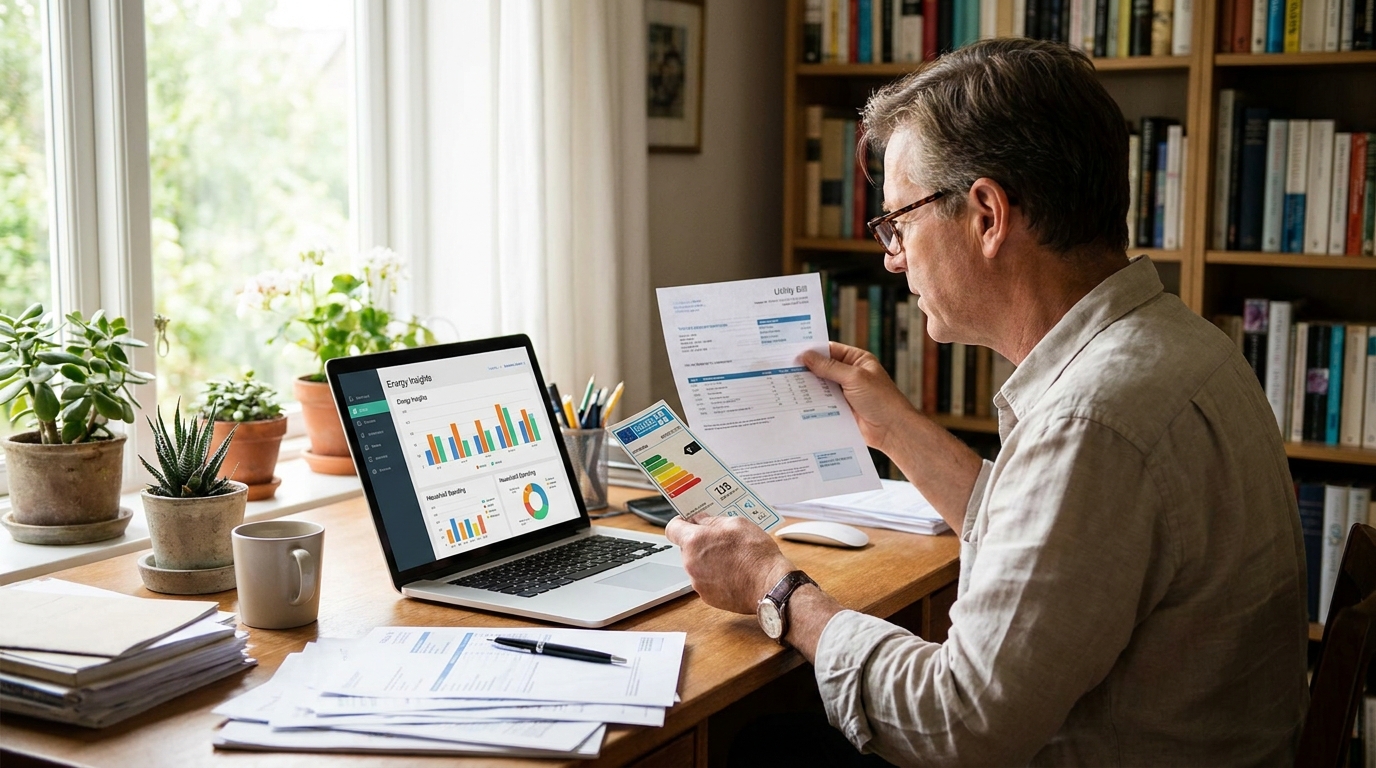
Your utility bill is still one of the most underrated analytics tools in the home. It provides trend data over time, often including total usage, billing period comparisons, and rate structures. A single bill may not tell you much, but twelve months of bills can reveal seasonality, sudden changes, and whether consumption is moving in the right direction. If you have changed occupancy, installed new equipment, or experienced severe weather, those factors should be noted next to the billing data so the comparison remains realistic.
The common mistake is to treat a lower bill as proof of better efficiency. That is not always true. Bills can fall because the winter was milder, because someone spent fewer days at home, or because the rate changed. Good household analytics tries to separate usage from circumstances. Even a simple note such as “cold snap,” “guests stayed for two weeks,” or “installed new dishwasher” helps turn raw billing data into a more useful record.
Smart meters and utility dashboards
The U.S. Department of Energy states that smart meters can show home energy use, help identify savings, and support remote control when paired with home energy management systems. Many utilities now provide online dashboards that show daily or hourly consumption. This shift matters because monthly totals can hide what is really driving usage. Hourly data can reveal that mornings are efficient but evenings spike, or that an HVAC system runs unusually hard at a certain time every day.
That level of visibility is often enough to catch unusual loads. A dehumidifier running continuously in a basement, a poorly timed electric water heater, or backup heating strips activating more than expected can all become visible when interval data is available. You do not need to interpret every line chart like an analyst. Instead, look for consistent peaks, sudden anomalies, and patterns that do not match how you think the home operates.
Smart thermostats
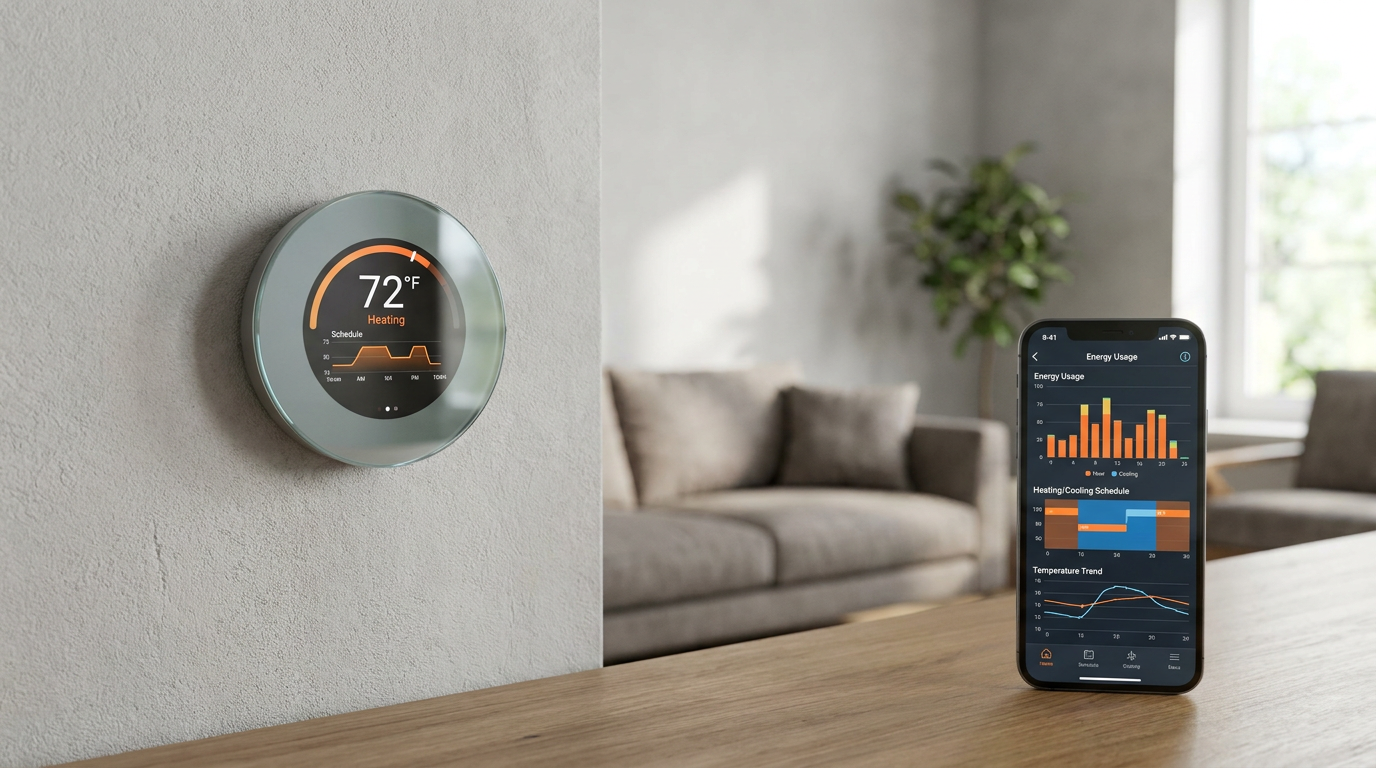
For many households, the smart thermostat is the gateway device into practical analytics. NRCan notes that ENERGY STAR certified smart thermostats can provide home energy use data so households can track and manage consumption. These systems often show run time, temperature schedules, occupancy settings, and remote adjustments through an app. That means homeowners can move from static settings to responsive control.
Still, there is an important nuance. Smart thermostats do not automatically save money in every home. Their actual value depends on climate, insulation quality, HVAC type, and household behavior. If a home is already well managed, savings may be modest. If schedules are inconsistent or the thermostat has been operating inefficiently, the savings may be stronger. NRCan has also highlighted the broader potential of smart thermostat adoption, estimating it could save 11 petajoules of energy, $248 million per year, and offset 774 kilotonnes of greenhouse gas emissions. That speaks to their role at both the household and system level.
Appliance labels and product efficiency data
Not all analytics comes from sensors. Labels matter too. ENERGY STAR and EnerGuide help translate product efficiency into consumer decision making. This distinction is important because these systems are related but not identical. EnerGuide generally helps consumers compare estimated energy performance, while ENERGY STAR certification indicates that a product meets a recognized efficiency threshold. Understanding the difference helps homeowners shop more intelligently rather than treating all labels as interchangeable.
These labels can support specific purchase decisions. NRCan reports that ENERGY STAR certified dishwashers use 12% less energy on average than standard models, while ENERGY STAR refrigerators use 9% less energy on average. Those gains may look modest in isolation, but they become more meaningful when combined with long appliance lifespans and rising utility costs. Household analytics works best when it helps prioritize replacements based on measurable operating impact, not only age or appearance.
Budgeting apps and spending dashboards
Household analytics is not only about energy. Financial patterns inside the home matter just as much. Budgeting tools can categorize spending on shelter, maintenance, utilities, food, insurance, and subscriptions, making it easier to see whether your home is becoming more expensive to operate over time. Because shelter spending is such a major household line item, combining energy data with broader budgeting data produces a more complete view of affordability.
This matters especially when homeowners are balancing trade offs. A more efficient appliance may lower long term costs but require a higher upfront payment. A smart thermostat may be partly offset by utility rebates, improving return on investment. Better insulation may reduce energy demand while increasing comfort and home value. Once spending is tracked by category, these decisions become easier to compare with actual household priorities.
How to build a simple household analytics system
The best system is the one you will actually use. For most households, a simple setup is better than a complicated one that gets abandoned after two weeks. A basic household analytics system should help you answer a handful of recurring questions: where is money going, when is energy use highest, what seems inefficient, and did recent changes help? If your setup can answer those questions clearly, it is already doing useful work.
Begin by creating a monthly baseline. Collect the past twelve months of utility bills if available. Add notes about unusual events such as travel, renovations, or extreme weather. Then list the major systems in your home: heating, cooling, water heating, laundry, refrigeration, cooking, lighting, and electronics. If you know the age and type of each major appliance or HVAC system, include that as well. This turns the home into a manageable operating profile rather than a vague set of expenses.
Next, connect the simplest available live data source. That may be a utility dashboard, a smart thermostat app, or a budgeting platform that categorizes household spending. Focus on one screen you can check regularly. If the system asks for too much attention, people stop using it. Good household analytics should reduce friction, not create another chore.
From there, define a small set of metrics that matter. Monthly energy use, average daily heating run time, utility cost by category, and maintenance spending are all useful examples. The exact dashboard will vary by home, but it should remain easy to interpret at a glance. Complexity is not the goal. Decision support is.
A beginner friendly framework
- Observe: Look at bills, thermostat data, and spending categories without changing anything yet.
- Identify the biggest load: In many homes, that will be heating and cooling, but validate it using your own data.
- Compare against expectations: Ask whether usage makes sense for the season, occupancy, and home size.
- Test one change at a time: Adjust thermostat schedules, reduce standby loads, or replace one appliance rather than changing everything at once.
- Monitor the result: Check whether the savings persist over several weeks or billing cycles.
- Scale what works: Repeat successful strategies in other parts of the home.
This disciplined approach matters because homeowners often make multiple changes at once and then cannot tell which one helped. Analytics is strongest when it isolates cause and effect as much as possible. If you lower the thermostat setpoint, seal a drafty window, and start running laundry at different times all in the same week, the outcome may be positive but harder to interpret. One change at a time creates cleaner learning.
Turning data into better living decisions
Household analytics becomes valuable when it improves everyday life, not just monthly charts. Better living can mean lower bills, but it can also mean steadier room temperatures, less stress around spending, fewer surprise repairs, and more confidence in household decisions. A data informed home is often a calmer home because fewer decisions rely on guesswork.
Consider heating and cooling. If the data shows high HVAC run time overnight, a modest setpoint adjustment may improve efficiency without affecting comfort. If one room remains cold while the system runs constantly, the issue may be air sealing or insulation rather than the thermostat itself. If cooling spikes sharply on weekends, occupancy patterns may explain it. Analytics helps connect comfort complaints to likely causes.
Now consider spending. A homeowner may feel that groceries are the main financial pressure while utility data shows a different story. Or a family may assume a major appliance upgrade is unaffordable until they compare energy savings, rebates, and maintenance reductions over time. Spending analytics makes trade offs visible. It can also reduce the emotional uncertainty that often surrounds home expenses.
There is also a sustainability dimension. As policy and consumer interest in electrification, heat pumps, and clean electricity grow, home level data becomes more useful for evaluating whether these transitions make sense in a specific property. Analytics helps answer practical questions such as whether an older furnace is creating high operating costs, whether insulation should come before equipment replacement, and whether a rebate backed upgrade would likely produce measurable value.
Common use cases every homeowner should know
Finding the most expensive appliance to run
One of the most common homeowner questions is simple: which appliance costs the most to run? The answer varies by household, but HVAC systems, water heating, clothes drying, and refrigeration are frequent contenders. If smart plug monitoring is available for smaller devices, that can add precision, but even without it, usage patterns and product labels can offer strong clues. The key is to focus on devices with long run times or high energy intensity rather than only those used frequently.
In some homes, a second refrigerator in the garage may be an overlooked source of waste. In others, an older dryer or electric resistance heater may be doing far more damage than expected. The goal is not to micromanage every watt. It is to identify the devices with meaningful savings potential and address those first.
Measuring whether upgrades actually save money
Homeowners often make improvements without a clear way to evaluate the result. After replacing windows, installing a smart thermostat, or buying a new refrigerator, they may rely on vague impressions rather than evidence. Household analytics changes that by providing a before and after framework. Compare usage over similar weather periods when possible, note occupancy changes, and watch whether reductions persist beyond the first month.
This is especially useful when rebates are involved. The expansion of connected thermostat ecosystems and demand response programs means some upgrades now come with financial incentives. That can improve payback, but homeowners still need to ask whether the actual operating outcome matches the sales promise. Data keeps the evaluation grounded.
Reducing standby power and small recurring waste
Not every improvement needs to be dramatic. Many homes contain a layer of small recurring waste, sometimes called vampire loads or standby power. Devices drawing energy while idle may not dominate the bill individually, but collectively they can become noticeable. Entertainment equipment, chargers, old network hardware, and unused kitchen devices are common examples.
Analytics helps here by making a diffuse issue visible. If overall usage remains high during hours when the home should be relatively quiet, standby loads may be part of the explanation. Smart power strips, unplugging habits, and selective device replacement can then be tested with measurable results.
Improving affordability under cost pressure
Household analytics also has an affordability role, especially as energy insecurity becomes a larger public concern. New U.S. RECS data releases include household energy insecurity measures, reflecting the fact that energy burden is not only a technical issue but a quality of life issue. For homeowners managing rising shelter costs, data can help identify where the most realistic relief exists. Sometimes that means a thermostat adjustment and a rebate application, not a major renovation.
That practical framing matters. Not every household can fund large capital projects. But nearly every household can review billing history, compare rates, assess schedules, and decide whether one targeted change could improve cash flow. Analytics should meet people where they are, not where idealized smart home marketing assumes they are.
Misconceptions that can lead homeowners in the wrong direction
One common misconception is that household analytics is only for tech enthusiasts. In reality, basic utility bill review and thermostat data already provide meaningful insight. A homeowner does not need machine learning models to discover that heating is running too hard or that shelter related spending is climbing faster than income. Starting small is not a limitation. It is often the most sensible method.
Another misconception is that smart thermostats automatically save money in every home. They can be highly useful, but outcomes depend on climate, building shell quality, occupancy patterns, and equipment type. In some homes, the thermostat is the right lever. In others, the real problem is insulation, duct leakage, or aging equipment. Analytics should point toward the real source of inefficiency rather than forcing every issue into the same solution.
A third misconception is that energy analytics means electricity analytics. That is incomplete. Heating and cooling may be powered by gas, electricity, oil, propane, or hybrid systems depending on the property. To understand cost and performance, homeowners need a whole home view. Looking only at one bill can hide major opportunities elsewhere.
There is also a subtle but important privacy misconception. Smart devices are not automatically privacy neutral. Before enabling detailed sharing through thermostats, utility dashboards, or connected appliances, review vendor data policies and utility program terms. Most homeowners will still find the benefits worthwhile, but informed consent matters. Data that helps you manage your home should also be handled in a way you understand.
How to compare products and programs more intelligently
As household analytics becomes more mainstream, homeowners will see more offers related to connected devices, efficiency upgrades, and utility programs. Some of these are genuinely valuable. Others are more useful in certain homes than in others. The key is to evaluate products based on measurable fit, not just marketing language.
When comparing a smart thermostat, ask whether it supports your HVAC type, whether local rebates are available, what data the app actually provides, and whether scheduling features match your household routine. When reviewing appliances, compare ENERGY STAR certification, estimated annual energy use, and likely operating hours in your home. When considering a demand response program, understand how often the utility may adjust connected devices and what incentives are offered in return.
Do not underestimate official information sources. NRCan, the DOE, EIA, EnerGuide, and ENERGY STAR all provide benchmarks that help translate product claims into more reliable context. Public data will not answer every household specific question, but it creates a more trustworthy starting point than relying only on advertising copy or anecdotal reviews.
A practical 30 day plan for getting started
If the topic still feels broad, narrow it to the next thirty days. In the first week, gather the last year of utility bills and note the major equipment in your home. In the second week, log into your utility dashboard if one exists, or set up access through your provider. If you have a smart thermostat, review its schedule, run time data, and comfort settings. In the third week, categorize recent household spending and identify the top home related cost pressures. In the fourth week, test one change and monitor the result.
A good first change might be adjusting the heating or cooling schedule by a small amount, especially if the house is empty during predictable hours. Another option is replacing a clearly inefficient appliance that is near the end of its life, ideally using ENERGY STAR and EnerGuide data to compare choices. A third option is reducing standby loads in rooms with many idle devices. The point is to choose one action with a clear before and after comparison.
At the end of the month, review what changed. Did energy use move in the expected direction? Did comfort improve, stay the same, or worsen? Did the adjustment reduce stress or create inconvenience? Household analytics should never be judged only by cost savings. The best changes are the ones that improve both economics and livability.
The future of household analytics
Household analytics is becoming more personalized, more visual, and more tied to incentives. Smart meters, utility dashboards, and connected thermostats continue to expand. Public data releases such as the EIA’s residential surveys provide more context on housing characteristics, end uses, and energy insecurity. Policy interest in electrification and building efficiency also means data will play a larger role in everything from heat pump adoption to rebate qualification.
For homeowners, this shift creates a real advantage. Better tools mean it is becoming easier to answer practical questions that once required professional audits or guesswork. Which appliance is costing the most? Is my upgrade actually saving money? When is my home using the most energy? Which purchase has the best return? These are no longer niche questions. They are becoming part of normal household management.
That does not mean every home needs a complex technology stack. In fact, the most resilient approach may be a hybrid one: use digital tools where they create clarity, use labels and public benchmarks when comparing products, and keep your own simple record of spending and system changes. The intelligence layer behind better housing decisions does not need to be complicated. It just needs to be consistent.
Final thoughts
Maximizing your home is not only about making it look better or increasing resale value. It is also about understanding how it works. Household analytics gives homeowners a structured way to see the patterns shaping comfort, cost, and efficiency. By focusing first on major loads like heating and cooling, then combining energy data with spending habits and product benchmarks, households can make sharper decisions with less uncertainty.
The strongest advantage of household analytics is that it turns abstract concerns into manageable actions. Instead of feeling that costs are simply rising everywhere at once, you can identify where the pressure is strongest. Instead of assuming a device or upgrade is helping, you can verify it. Instead of treating your home as a set of disconnected expenses, you can view it as a living system with measurable performance.
For beginners, that is more than enough. Start with what you already have, observe the biggest patterns, test one change at a time, and let the results guide the next decision. In a market where shelter costs, energy costs, and technology choices all matter more than they used to, that kind of clarity is not a luxury. It is one of the most practical upgrades a homeowner can make.



No Comment! Be the first one.