



Traffic analysis sounds technical, but its purpose is deeply practical. It helps cities understand how people, vehicles, and goods move through streets, intersections, corridors, and neighbourhoods so they can make better decisions about transportation. At its core, traffic analysis is the measurement and interpretation of movement across a road network, yet modern practice now goes much further than counting cars. It is increasingly used to improve urban mobility as a whole, which means considering the needs of pedestrians, cyclists, transit riders, freight operators, and drivers together rather than in isolation.
Table Of Content
- What traffic analysis actually measures
- Why cities rely on traffic analysis
- From manual counts to real-time intelligence
- Computer vision and the new traffic dashboard
- Why travel time and reliability matter more than raw volume
- Traffic analysis is not only about cars
- What Canadian congestion trends reveal
- How cities turn analysis into action
- Adaptive signal control and corridor management
- Transit priority and multimodal timing
- The governance challenge behind smart traffic systems
- Traffic analysis and climate, health, and quality of life
- Common misconceptions about traffic analysis
- The future of traffic analysis in urban intelligence
- Conclusion
That shift matters because cities are under pressure from several directions at once. Congestion remains costly, travel patterns continue to change after the pandemic, and residents expect safer, cleaner, more accessible streets. Municipal teams also have better tools than they had a decade ago. Instead of relying only on periodic surveys and manual counts, they can now use connected vehicle data, traffic cameras, roadway sensors, and computer vision systems that generate near real-time information about how networks are performing.
In Canada and across North America, this transformation is reshaping both operations and planning. Statistics Canada now publishes an experimental Traffic Flow Dashboard that uses traffic camera imagery and computer vision to estimate real-time counts of cars, trucks, buses, and motorcycles. Transport Canada tracks urban mobility through indicators such as the Travel Time Index, which compares actual travel time with free-flow conditions. Together, these tools reveal a clearer picture of where congestion forms, when reliability breaks down, how corridors recover after disruptions, and what cities can do next.
This is why traffic analysis should be understood as an intelligence layer for urban systems. It does not simply describe delay. It helps decision makers retime signals, prioritize buses, improve crossings, manage freight routes, and plan long-term investments. When cities use traffic data well, they can reduce waste, protect productivity, improve safety, and move closer to transportation systems that support both mobility and quality of life.
To understand why this field now matters so much, it helps to start with the basics. Traffic analysis is not new, but its speed, scope, and relevance have changed dramatically. What was once a narrow engineering function is now part of a broader urban strategy that connects data, planning, technology, and public policy.
What traffic analysis actually measures
Traditional traffic analysis focused heavily on vehicle volumes. Engineers counted how many cars passed through an intersection, how long queues became, and whether a road was operating above or below its intended capacity. Those measurements still matter, especially on busy arterials and freight corridors, but they are only one piece of the picture. Urban mobility depends not just on how many vehicles use a street, but on how reliably people can move, how safely they can cross, and how well different modes work together.
Modern traffic analysis therefore looks at a broader family of indicators. These often include travel times, speed variation, delay, queue length, intersection performance, route reliability, transit running times, pedestrian crossing demand, cycling volumes, and freight movement patterns. In practice, this means analysts are asking more useful questions. Is a corridor predictably slow every weekday morning, or only when weather changes? Do buses lose time at a certain signal cycle? Are pedestrians waiting too long to cross? Does a logistics route remain reliable enough for deliveries during peak periods?
One of the most useful metrics in this context is the Travel Time Index. Transport Canada explains it as the ratio of actual travel time to free-flow travel time. If a trip takes 20 minutes in uncongested conditions but 30 minutes during the peak, the index is 1.5. This kind of measure is powerful because it captures what travelers actually feel. People do not experience mobility as an abstract vehicle count. They experience it as time, predictability, and friction in everyday travel.
There is also a growing focus on reliability rather than simple speed. A corridor that is modestly slow but consistent may be easier to manage than one that is fast one day and unpredictable the next. Reliability matters especially for transit operations, emergency access, school commutes, and freight logistics. It is one reason why traffic analysis has become important far beyond the traffic engineering department. It now informs economic planning, environmental policy, infrastructure budgeting, and accessibility goals.
Why cities rely on traffic analysis
Cities use traffic analysis because transportation networks are dynamic systems. Conditions change by hour, season, land use, weather, school schedules, remote work patterns, and special events. Without data, planners and operators are left reacting to complaints or relying on assumptions. With good data, they can detect patterns early, test interventions, and understand whether a change actually improved the system.
At the operational level, traffic analysis supports decisions such as signal retiming, transit signal priority, lane management, incident response, construction detours, and corridor coordination. If travel times spike repeatedly along a particular route between 7:30 and 9:00 a.m., signal timing plans can be adjusted to improve progression. If bus delays concentrate at a few intersections, transit priority can be introduced to shorten red phases when a vehicle approaches. If a pedestrian-heavy district shows long crossing delays and safety conflicts, timing can be redesigned to create more predictable movement for people on foot.
At the planning level, the same data helps answer longer-term questions. Should the city redesign an arterial to include bus-only lanes or protected bike lanes? Does a fast-growing area need stronger transit service? Is a freight corridor losing reliability because of mixed traffic pressures? Should public investment focus on widening, reallocation, pricing, or demand management instead? Traffic analysis is useful because it moves those debates from anecdote toward evidence.
The stakes are not small. Transport Canada reports that the transportation and warehousing sector contributed $96.5 billion, or 4.3% of GDP, in 2024 and supports nearly a million direct and indirect jobs. Earlier Canadian estimates cited by Transport Canada placed the annual cost of congestion in the country’s nine largest cities at $3.1 to $4.6 billion. That makes traffic analysis more than a technical exercise. It is part of protecting productivity, reducing fuel waste, and maintaining the reliability of daily urban life.
Traffic analysis is no longer just a tool for moving more cars. It is a decision-support system for making urban transportation safer, more reliable, more efficient, and more inclusive.
From manual counts to real-time intelligence
One of the biggest changes in this field is the move from sparse snapshots to continuous observation. Historically, traffic studies often depended on manual turning movement counts, pneumatic tubes, embedded loop detectors, or occasional travel surveys. These methods still provide value, especially for detailed intersection work, but they are limited in time and scale. A manual count tells you what happened during a particular window. It does not automatically reveal how patterns evolve throughout the week, during construction, or after a land use shift.
Today, cities have access to a wider range of data streams. GPS and probe vehicle data reveal travel times across corridors and regions. Transit systems produce vehicle location feeds. Smartphone and mobile data can inform origin-destination analysis at a broader level. Roadside sensors and connected infrastructure can monitor speed and occupancy. Traffic cameras, once used mainly for visual monitoring, are now becoming machine-readable inputs through computer vision.
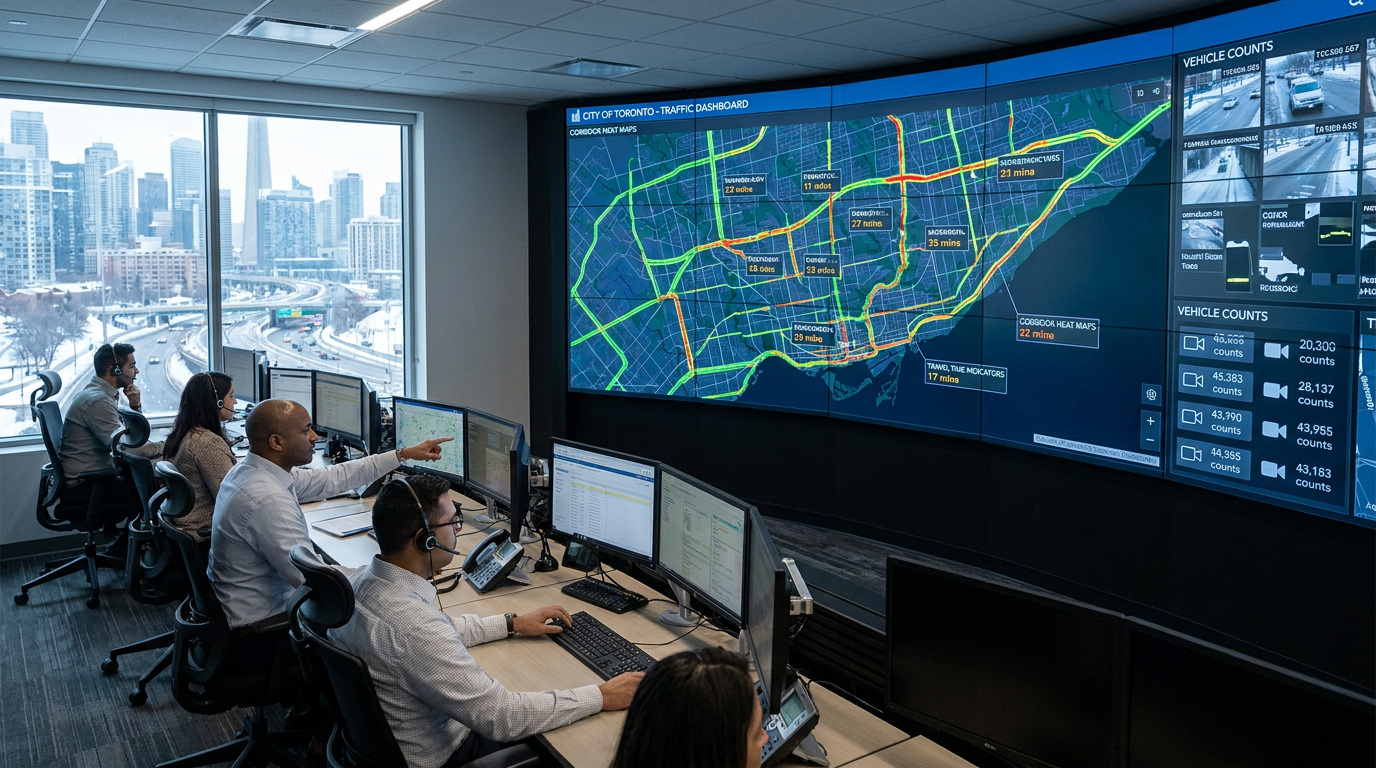
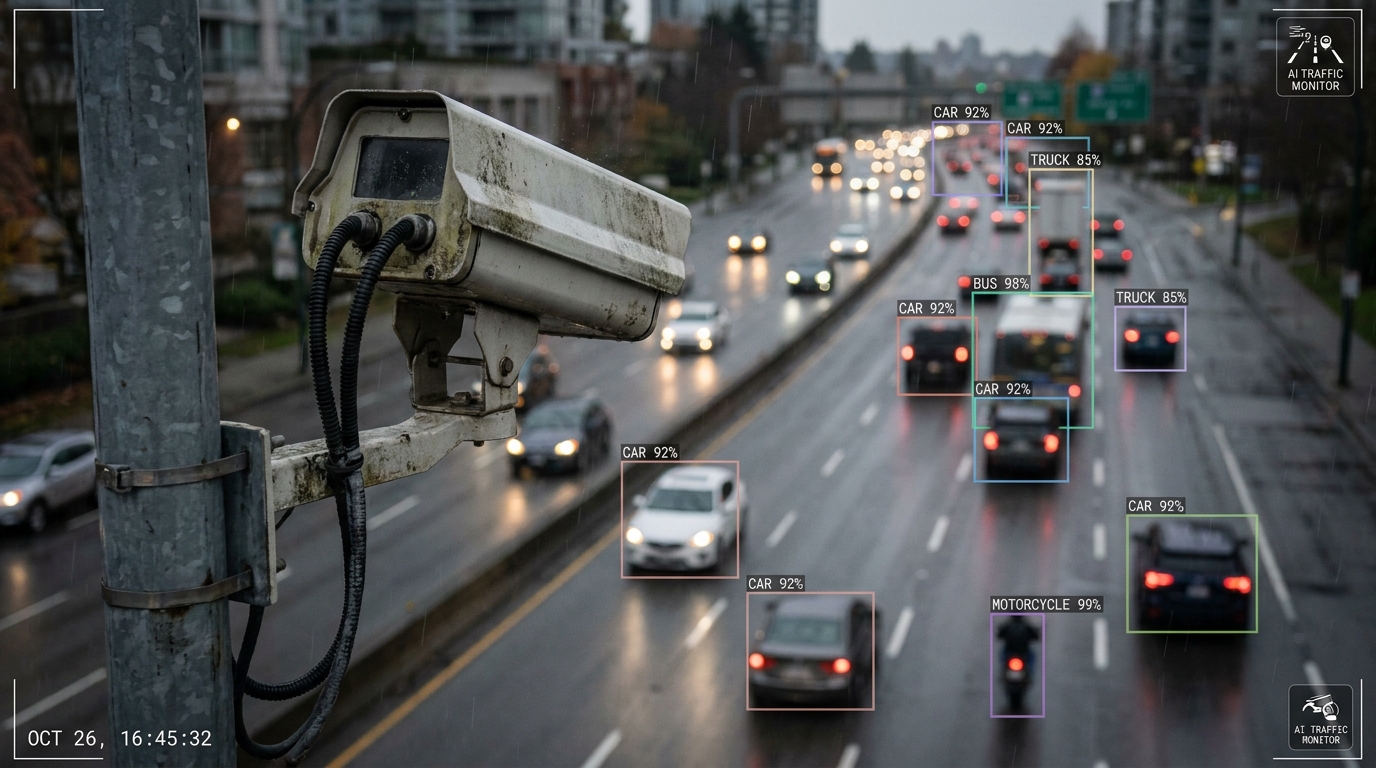
Statistics Canada’s experimental Traffic Flow Dashboard is a strong example of this shift. The platform uses traffic camera imagery sourced from municipal and provincial APIs and applies a YOLOv3-based computer vision model to detect and count vehicles in near real time. Rather than simply showing a live camera feed, the system converts visual information into structured data for cars, trucks, buses, and motorcycles. This is important because it turns existing infrastructure into an analytic resource and gives cities far more frequent observations than traditional count programs alone.
Real-time or near-real-time monitoring changes the rhythm of transportation management. Instead of waiting for quarterly reviews or annual studies, operators can observe congestion patterns by corridor and by time of day, identify unusual shifts, and intervene more quickly. Over time, the same data can also reveal seasonality, school-year effects, event impacts, and post-disruption recovery patterns. In short, the network becomes more legible.
Computer vision and the new traffic dashboard
Computer vision deserves special attention because it is one of the most practical advances in traffic analysis today. The concept is simple: software interprets images or video from traffic cameras and identifies movement patterns that human viewers would otherwise have to review manually. In transportation, that often means detecting different vehicle types, counting flows, and potentially tracking turning movements, lane use, queue formation, or conflict patterns depending on the system.
The value of this technology is not only automation. It is also consistency and scale. A city with hundreds of cameras cannot extract useful data from them if each feed requires manual review. Computer vision makes it possible to transform distributed camera infrastructure into a network of digital sensors. That means analysts can compare corridors more often, discover anomalies faster, and build richer historical records without dramatically increasing labour costs.
Statistics Canada’s research emphasizes that real-time traffic data are essential for urban and regional policy applications. That framing is important. The point is not to collect data for its own sake. The point is to support decisions. If camera-based analytics show that truck volumes rise significantly on a corridor during certain hours, the city may reconsider curb regulations, loading zones, or freight routing. If buses are being delayed by recurring queue spillback, the city may test queue-jump lanes or signal priority. If motorcycles, cars, and buses distribute differently by season, timing plans may need to be adjusted to reflect actual demand rather than assumptions.
Computer vision also broadens what is visible in the public right of way. Embedded road detectors are useful but fixed in function and location. Cameras can capture more nuanced behaviour, especially at complex intersections and urban streets where multiple modes interact. That makes them especially relevant to city environments where mobility goals extend beyond vehicle throughput.
Why travel time and reliability matter more than raw volume
For many years, transportation discussions were dominated by volume and level-of-service language. Those measures still have technical uses, but they can miss the lived reality of mobility. A street may carry many vehicles while still failing transit riders, cyclists, or pedestrians. A road may operate at high speeds while producing dangerous crossings and unreliable bus service. That is why many agencies now pay closer attention to travel time, reliability, and multimodal performance.
The Travel Time Index is especially useful because it converts congestion into something intuitive. It asks how much longer a trip takes than it would under uncongested conditions. This is easy to compare across corridors and across time. It also makes post-pandemic shifts easier to interpret because the issue is not merely whether roads are busy, but how observed travel behaviour is changing against a baseline of free-flow movement.
Reliability metrics add another layer. A commuter, delivery operator, or transit rider can plan around a trip that is always 25 minutes. They struggle with a trip that varies between 15 and 40 minutes. Reliability affects labour scheduling, school arrival, fleet management, and personal routines. It also affects confidence in alternatives to driving. If transit becomes more reliable through traffic management, some travelers may shift modes, creating network effects that improve overall mobility.
In the United States, the Federal Highway Administration’s Quarterly Urban Congestion Report now characterizes congestion and reliability trends at both national and city levels using performance measures weighted by traffic volumes. That kind of reporting signals how mature traffic analysis has become across North America. Cities and agencies are no longer asking only how many vehicles use a road. They are asking how well the network performs under real conditions and for whom.
Traffic analysis is not only about cars
One of the most persistent misconceptions about traffic analysis is that it exists solely to reduce delay for private vehicles. That view is outdated. Modern urban transportation practice increasingly treats the street network as a multimodal system. The objective is not simply to move the maximum number of cars through an intersection. It is to balance movement, safety, access, and livability across different users and trip purposes.
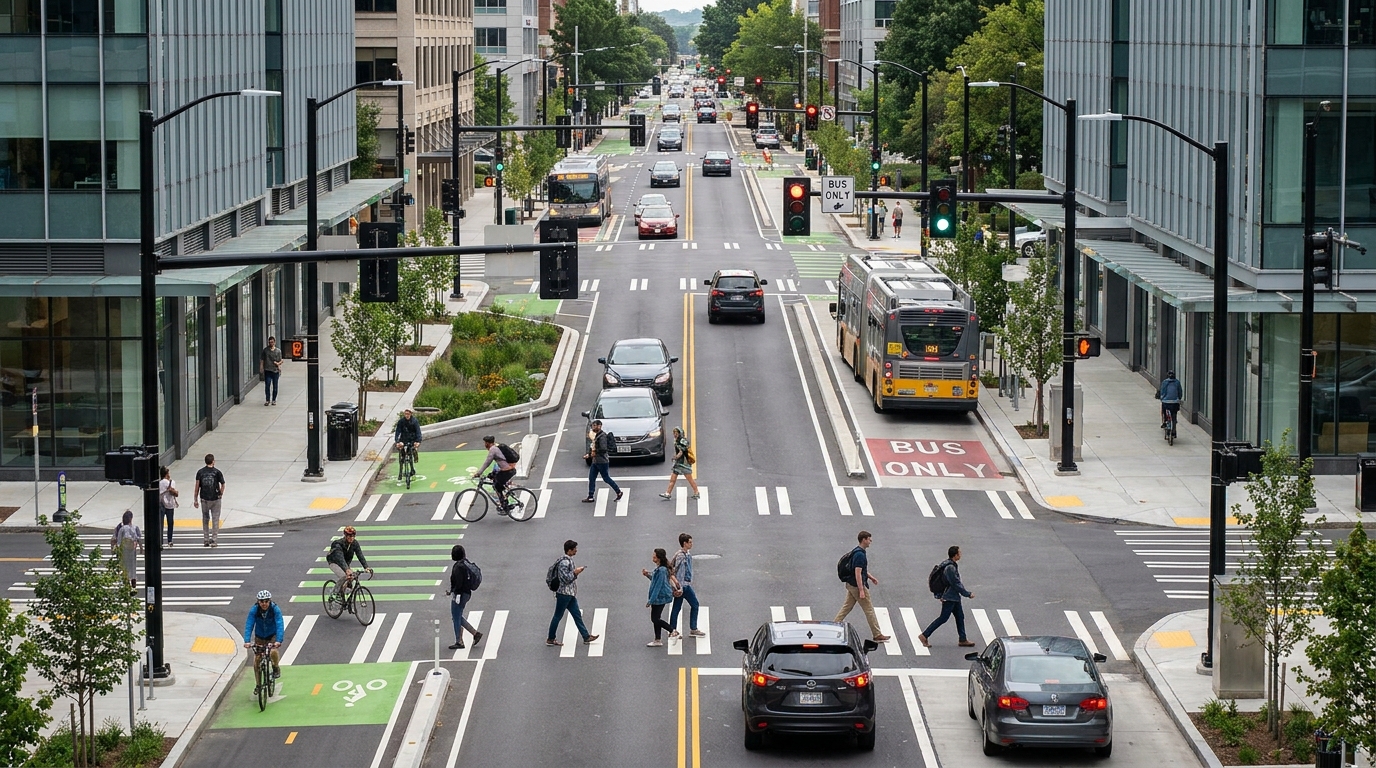
NACTO’s guidance on traffic signals makes this clear. Signal timing influences delay, safety, compliance, mode choice, and even economic vitality. In other words, timing is not a neutral technical setting. It shapes how a street feels and functions. Coordinated timing can be designed not only for vehicle progression but also for bicycles, pedestrians, and transit. That means a city can use the same analytical tools to support safer crossings, more predictable bus operations, and cycling routes that feel coherent rather than fragmented.
Consider what this means at a busy downtown intersection. If the entire timing plan is built around maximizing green time for cars, pedestrians may endure long waits, buses may remain trapped in general traffic, and cyclists may face uncomfortable stop-and-go movement. If the same intersection is analyzed as part of a multimodal corridor, the timing strategy may change. The city might introduce leading pedestrian intervals, protected phases, transit priority, or progression calibrated to urban cycling speeds. Traffic analysis is what allows those trade-offs to be made deliberately rather than by habit.
This is also why better data does not automatically mean a city will choose the right outcome. Data can tell officials how a corridor performs, but policy determines what performance means. If the goal is safer school travel, the answer may not be faster car movement. If the goal is stronger transit reliability, general traffic may need to absorb some delay. Traffic analysis is powerful precisely because it makes those choices visible.
What Canadian congestion trends reveal
Recent Canadian data shows why local context matters. Transport Canada’s reporting indicates that congestion recovery after the pandemic has not followed a single national pattern. In 2024, Montreal’s average congestion level was 9% higher than in 2019, while Calgary’s was 9% lower. In 2023, Montreal was 18% above 2019, while Toronto was 20% below, Vancouver 6% below, and Calgary 11% below. These differences are too large to dismiss as noise.
They suggest that congestion is shaped by local combinations of remote work adoption, downtown activity, network design, transit conditions, housing geography, and economic structure. A city with strong hybrid work patterns and a dispersed employment base may see lower peak pressure than one with more centralized travel demand. A metro with constrained bridges, historic street patterns, or uneven transit recovery may experience a very different return trajectory even if its population growth is similar.
This matters for analysts because it challenges the idea of one-size-fits-all solutions. If congestion patterns are highly local, then traffic interventions must be local too. A city should not simply copy another city’s signal timing, corridor strategy, or demand management plan without understanding its own travel behaviour. Data-driven transportation planning works best when it respects geography and governance rather than searching for universal formulas.
It also reminds us that peak congestion is only one dimension of urban mobility. Some places may experience lower overall congestion but worse transit reliability, weaker walking environments, or growing suburban accessibility gaps. Good traffic analysis helps agencies avoid false comfort by asking what conditions have improved, for whom, and at what cost.
How cities turn analysis into action
Data is only valuable when it changes decisions. In practice, cities tend to use traffic analysis in several interconnected ways, combining short-term operational improvements with longer-term planning choices. The most effective agencies treat analytics as part of a feedback loop rather than a one-time study. They measure conditions, test interventions, observe results, and refine policy.
Some of the most common ways cities apply traffic analysis include the following:
- Signal retiming and coordination to reduce unnecessary delay and smooth flow along major corridors.
- Adaptive signal control that adjusts timing based on changing traffic demand throughout the day.
- Transit signal priority to improve bus and streetcar reliability at delay-prone intersections.
- Pedestrian and cycling improvements such as leading pedestrian intervals, revised crossing times, and progression strategies for bike routes.
- Construction and incident management using real-time travel data to detect unusual disruption and communicate detours.
- Freight and curb management through better understanding of truck movements, loading demand, and corridor reliability.
- Capital planning for transit expansion, arterial redesign, ITS deployment, and targeted network upgrades.
Each of these actions reflects an important principle. Traffic analysis should support specific decisions. The best dashboards are not the most visually complex ones. They are the ones that help an operator, planner, or elected official answer a concrete question with confidence.
Adaptive signal control and corridor management
Adaptive signal control is often presented as a high-tech fix, but its practical value lies in responsiveness. Instead of following static timing plans that may no longer match actual demand, adaptive systems adjust based on current conditions. On corridors where traffic varies sharply by time of day or by event conditions, this can improve progression and reduce inefficient delay. It can also help cities respond more gracefully to incidents and temporary surges.
Corridor management works best when agencies combine signal data, travel time observations, and field context. A corridor is not just a collection of intersections. It is a sequence of interactions. Queue spillback from one bottleneck can damage upstream performance, bus stops can affect lane operations, and pedestrian-heavy nodes can require different timing logic than adjacent segments. Traffic analysis helps reveal these relationships.
Transit priority and multimodal timing
Transit signal priority is a good example of how urban mobility goals reshape traffic analysis. A bus carrying 50 people should not be evaluated the same way as a car carrying one or two. Yet without data, many networks still give transit little operational advantage. By identifying where buses consistently lose time, cities can target signal priority, queue jumps, dedicated lanes, or stop consolidation where they will have the greatest effect.
Multimodal timing extends this principle. Cities can calibrate crossing intervals to real pedestrian volumes, adjust timings near schools and senior facilities, and support cycling progression on routes where people travel at predictable urban bike speeds. These changes may seem small at the individual intersection level, but together they shape whether a network feels efficient, safe, and usable for people who are not driving.
The governance challenge behind smart traffic systems
It is tempting to think that better technology automatically produces better transportation outcomes. In reality, implementation capacity often determines success more than the sophistication of the tool. Cities vary widely in staff resources, procurement flexibility, data standards, interdepartmental coordination, and long-term maintenance planning. A real-time dashboard can be impressive, but if no one is responsible for acting on what it shows, its public value remains limited.
This is one reason Canadian work on urban mobility innovation often emphasizes governance and preparedness alongside technology. Municipalities need data-sharing agreements, interoperable systems, clear policy goals, and staff who can translate analytics into operations and planning. They also need ways to connect traffic data with transit data, land-use data, safety records, and climate targets. Without that integration, agencies risk optimizing one part of the system while overlooking broader urban outcomes.
Open data platforms and transportation data hubs are becoming more important for this reason. They create a shared evidence base across departments and, in some cases, for the public as well. When traffic, transit, and land-use information can be examined together, decision makers are better positioned to understand cause and effect. A recurring congestion problem may not be solvable through signal timing alone if it reflects deeper issues in land use mix, transit capacity, or school travel design.
Governance also includes setting priorities explicitly. A city that says safety comes first should reflect that in how it interprets traffic data. A city focused on emissions reduction should examine idling, trip length, and mode shift potential rather than only corridor speed. Good analysis does not replace policy judgment. It sharpens it.
Traffic analysis and climate, health, and quality of life
Urban mobility decisions shape more than travel time. They influence local air quality, fuel consumption, noise, public health, and access to opportunity. This is where traffic analysis becomes relevant to climate and livability goals. If data helps reduce excessive idling, smooth stop-and-go conditions, or prioritize high-capacity modes such as transit, the benefits extend well beyond congestion relief.
That does not mean every congestion problem should be solved by increasing vehicle speed. In dense urban settings, faster car movement can conflict with pedestrian safety, cycling comfort, or retail vitality. The more useful framing is network efficiency and accessibility. How can the city help people reach jobs, schools, services, and amenities in ways that are reliable and low-friction? Sometimes that means better signal coordination. Sometimes it means transit priority, curb management, protected bike lanes, or demand management measures that reduce pressure on the network in the first place.
Traffic analysis supports these choices by identifying where inefficiencies and trade-offs are concentrated. It can show where buses are being delayed by turning traffic, where loading activity is blocking lanes, where crossing demand exceeds timing assumptions, or where recurring bottlenecks create unnecessary emissions. In this sense, data is not only about movement. It is about urban quality.
Reducing congestion is not always the same as improving mobility. The best traffic analysis helps cities see the difference and choose solutions that align with safety, access, and climate goals.
Common misconceptions about traffic analysis
Because the field is increasingly visible through dashboards and AI tools, misconceptions are easy to spread. Clearing them up is useful for anyone trying to understand how transportation data is actually used.
- Traffic analysis is only about car congestion. In reality, it also supports pedestrian safety, cycling conditions, transit reliability, freight operations, and accessibility planning.
- More data automatically creates better outcomes. Data still requires policy direction, governance, and implementation capacity to produce meaningful change.
- Real-time dashboards replace long-term planning data. They do not. Cities still need origin-destination studies, household travel surveys, and land-use analysis for strategic planning.
- Congestion trends are uniform across regions. They are not. Canadian city data shows that post-pandemic recovery remains highly local.
- Traffic monitoring depends only on road sensors. Modern systems increasingly use cameras, GPS probe data, mobile data, and sensor fusion.
These distinctions matter because they shape public expectations. If residents assume that a smart dashboard should instantly fix traffic, disappointment is inevitable. If they understand that analytics is one part of a broader decision system, the value becomes clearer. The real strength of traffic analysis is not magic. It is disciplined visibility into how urban systems behave.
The future of traffic analysis in urban intelligence
Looking ahead, traffic analysis will likely become more integrated, more predictive, and more multimodal. Cities are moving toward transportation data environments where traffic, transit, weather, incidents, curb activity, and land-use change can be examined together. That creates the foundation for more intelligent operations and more informed planning. It also opens the door to forecasting, scenario testing, and targeted investment decisions.
Connected vehicles and intelligent transportation systems will expand what agencies can observe in real time. Sensor fusion will help combine camera data, probe travel times, and infrastructure signals into more reliable operational pictures. Machine learning may improve anomaly detection, corridor forecasting, and incident response. But even as the tools become more advanced, the central questions will remain human ones. Who is being delayed? Who is being excluded? Which improvements create real mobility gains rather than just cosmetic speed gains?
The most effective cities will be the ones that treat traffic analysis as part of urban intelligence, not as a silo. That means linking transportation data to housing growth, employment patterns, school access, freight demand, and public realm design. It means measuring streets not just as channels for throughput but as civic spaces where mobility, safety, and economic life intersect.
For residents, the effects may appear simple. A bus becomes more reliable. A crossing feels safer. Deliveries arrive more predictably. Rush-hour travel becomes less volatile. Yet underneath those outcomes is a growing analytical layer that helps cities understand movement with greater precision than ever before. That is the real story of modern traffic analysis. It is not just about counting what passes through a road. It is about using data to shape cities that function better for the people who live in them.
Conclusion
Traffic analysis has evolved from a narrow engineering practice into a central tool of modern urban mobility. With metrics such as the Travel Time Index, technologies such as computer vision, and growing access to real-time data, cities can now see transportation networks with much more clarity. That visibility helps them manage congestion, improve transit reliability, support safer walking and cycling, strengthen freight performance, and plan smarter infrastructure investments.
Canadian evidence shows that congestion and recovery patterns are highly local, which makes good analysis even more important. There is no universal blueprint for managing urban movement. What works in Montreal may not fit Calgary, Toronto, or Vancouver. The job of traffic analysis is to reveal those differences and support better choices.
When used well, traffic data becomes more than a monitoring tool. It becomes a strategic asset for livability, productivity, accessibility, and climate resilience. In that sense, understanding traffic analysis is really about understanding how cities learn. The smarter the data layer becomes, the better chance urban systems have of moving people and goods efficiently while still creating safer, healthier, and more inclusive streets.


No Comment! Be the first one.