What Bitcoin’s $60,000 Rebound Says About Risk Appetite
Bitcoin moving back above $60,000 is not just a crypto story. It is a liquidity story, and liquidity still matters across every investable asset class, from digital assets to listed equities and income-producing real estate.
According to FXStreet, Bitcoin recovered on Monday after a sharp weekly correction, helped by improved market sentiment following reports that the United States and Iran agreed to halt recent attacks and resume talks linked to the Strait of Hormuz. For investors, the key point is not that geopolitical risk has disappeared. It has not. The point is that capital remains highly sensitive to geopolitical headlines, ETF flows and technical support levels.
The more important signal sits beneath the price. Spot Bitcoin ETFs recorded roughly $1.70 billion to $1.79 billion in net outflows last week, depending on the cited data point, marking the heaviest weekly selling pressure since late February. June outflows reportedly reached $4.06 billion, the second consecutive month of redemptions and the largest monthly outflow since spot Bitcoin ETFs launched.
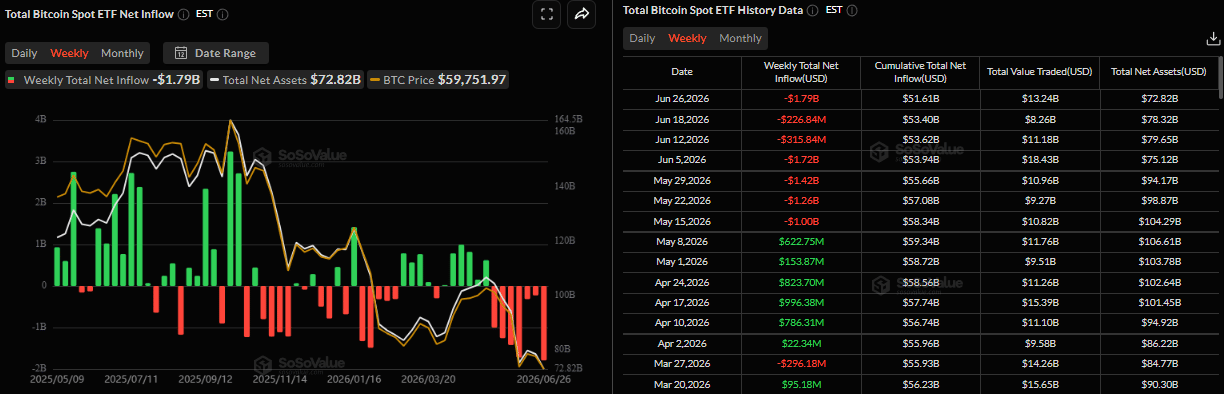
That matters because institutional participation has been one of Bitcoin’s strongest support arguments. When ETF demand turns negative for several weeks, Bitcoin loses a major buyer base. The asset can still rebound, but the quality of that rebound becomes more questionable. Price recovery without renewed institutional inflows is often a trading bounce, not yet a durable allocation trend.
For KG Invest readers, the lesson is broader than crypto. Risk assets are increasingly connected by the same macro inputs: interest rate expectations, dollar liquidity, geopolitical risk and institutional fund flows. When large investors reduce exposure to volatile assets, it can signal a more defensive posture across portfolios. That can eventually influence property-adjacent markets too, particularly listed real estate, development finance, private credit and high-yield funding conditions.
Bitcoin’s rebound is less important than whether institutional capital returns behind it.
Technically, FXStreet notes that Bitcoin closed below its 200-week simple moving average near $62,643 and touched a yearly low around $58,115. The $58,000 area has become the immediate line investors are watching. If it holds, a move back toward the 200-week average is plausible. If it breaks on a weekly basis, the next cited support sits near $55,777.
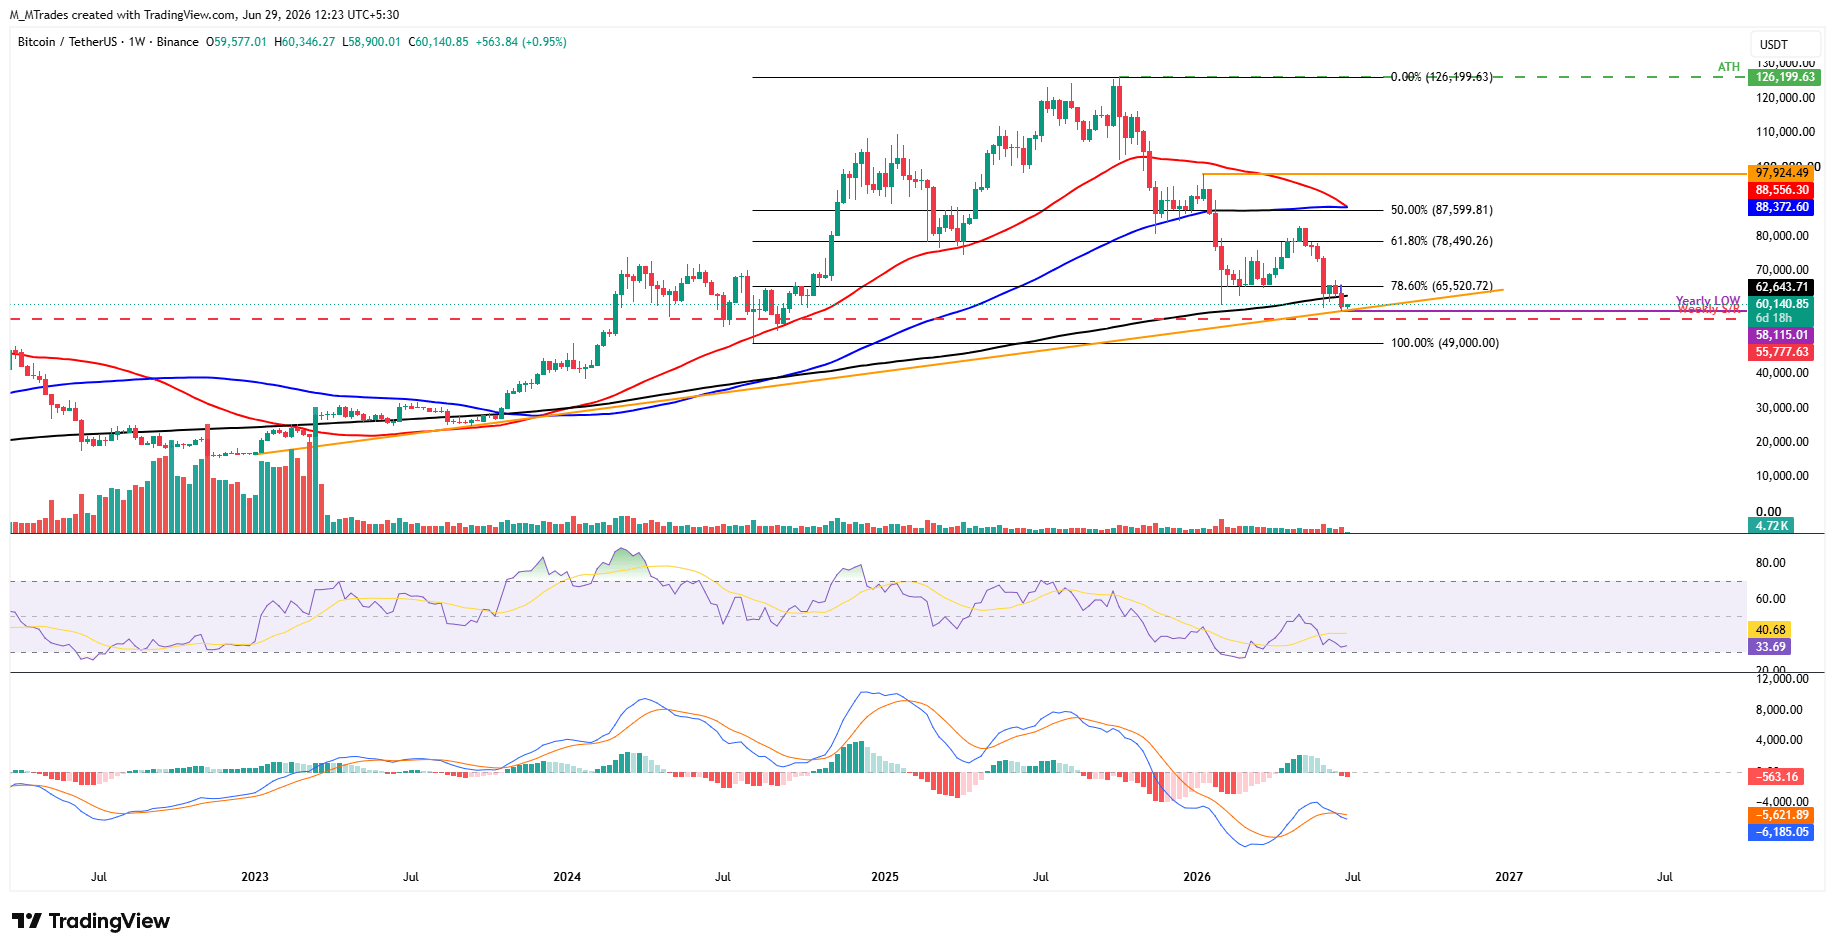
Momentum indicators remain cautious. The weekly RSI was reported near 33, close to oversold territory, while the MACD has shifted into a bearish crossover. On the daily chart, Bitcoin remains below its 50-day, 100-day and 200-day exponential moving averages. That creates a layered resistance zone, with $64,004, $66,969 and $70,590 all relevant levels before the broader structure improves.
Investors should avoid reading Monday’s recovery as a clean reversal. It is better viewed as a test of market appetite after a period of institutional selling and geopolitical stress. A sustained move higher would likely require more than calmer headlines. It would need ETF outflows to slow, technical resistance to be reclaimed and broader risk sentiment to remain constructive.
The practical takeaway is discipline. Whether allocating to Bitcoin, real estate debt, listed property vehicles or private assets, investors should separate price movement from capital flow. Price tells you what happened today. Flows tell you who is willing to stand behind the market tomorrow.
Source: FXStreet