



Construction has always been a people business, but it is increasingly becoming a data business too. Across Canada and the United States, contractors are dealing with a difficult mix of labor shortages, thin margins, schedule pressure, and inconsistent productivity. In that environment, labor analytics is no longer a niche digital experiment. It is becoming a practical way to understand how work really happens on site and how to improve it.
Table Of Content
- Why labor analytics is becoming urgent in construction
- What labor analytics actually means
- The technologies making labor analytics practical
- Where the value shows up first
- Real-world applications changing how jobsites are managed
- Activity-level productivity tracking
- Delay prediction and schedule risk detection
- Earthwork and heavy civil optimization
- Trade performance in building projects
- Case study logic: what successful implementations have in common
- Labor analytics and small-firm adoption in Canada
- How labor analytics supports leaner, smarter project delivery
- Common misconceptions that hold firms back
- A practical roadmap for getting started
- The future of construction efficiency is measurable
The timing matters. Statistics Canada found that labour productivity in Canadian residential construction fell 37.3% from 2001 to 2023, which works out to an average annual decline of 2.1%. Broader construction productivity was essentially flat over a long stretch as well, which suggests that the industry has not been gaining efficiency at the pace seen in other sectors. When productivity weakens while costs, complexity, and deadlines intensify, better labor insight becomes essential rather than optional.
Labor analytics gives contractors a way to see beyond total labor hours and payroll reports. It helps them understand where time is going, which crews are being used effectively, what types of delays are recurring, and how project conditions are affecting output. The result is not just more tracking. The result is better planning, cleaner execution, and more confident decision making.
This matters especially in construction because the labor problem is not only about availability. It is also about utilization. Many projects lose performance not because crews are unskilled or unwilling, but because sequencing is poor, materials arrive late, equipment is unavailable, rework interrupts flow, or one trade is forced to wait on another. Labor analytics helps expose those hidden inefficiencies and turn them into manageable problems.
In this article, we will look at why labor analytics is gaining momentum, what technologies are driving it, how real-world applications are delivering value, and what successful implementation actually looks like. The bigger point is simple: construction efficiency improves when firms stop guessing how labor is performing and start measuring the conditions that shape productivity every day.
Why labor analytics is becoming urgent in construction
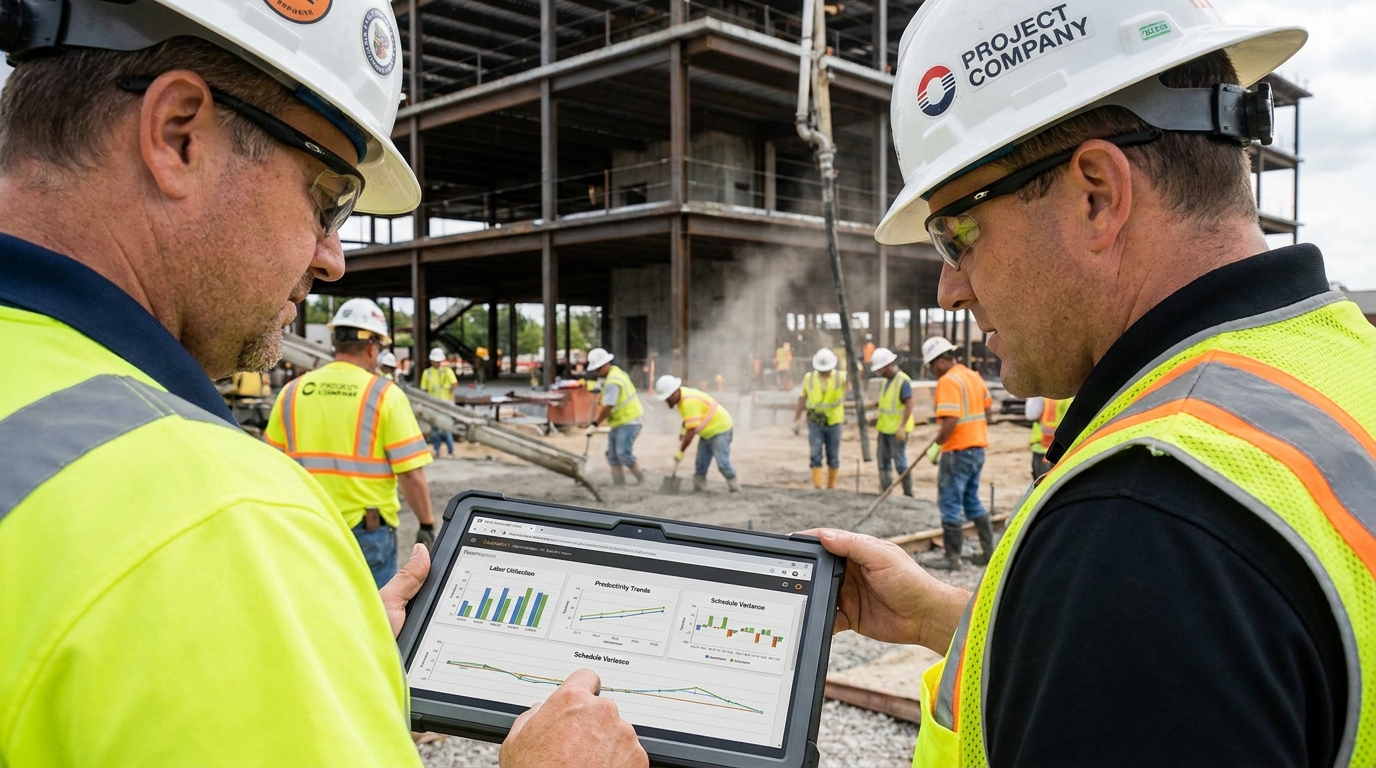
The construction industry has lived with productivity concerns for years, but the current pressure is more structural than cyclical. Canada’s construction sector employs more than 1.6 million workers and contributes about 7.5% of GDP, which makes underperformance economically significant. At the same time, many firms are trying to build more housing and infrastructure with a workforce that is difficult to expand quickly. That combination creates a clear incentive to get more output from existing labor capacity.
The industry structure also explains why progress has been uneven. Statistics Canada reported that employers with fewer than 20 workers accounted for 66.1% of employment in residential construction in 2023. Small firms often operate with limited back-office systems, fragmented field reporting, and little dedicated analytics capacity. They may know their crews well on a personal level, but still lack precise, consistent data on utilization, output, absenteeism, or work interruptions.
Labor scarcity compounds the issue. According to the 2025 AGC and NCCER workforce survey in the United States, 92% of construction companies had difficulty hiring for open positions, and 45% said labor shortages were causing project delays. Those numbers capture a reality that many contractors across North America already feel every day. When labor is scarce, every lost hour becomes more expensive, and every preventable delay affects multiple trades and project outcomes.
Another signal comes from capacity. Statistics Canada reported that the construction sector’s industrial capacity utilization rate was 82.7% in the first quarter of 2024, down from 92.9% in the second quarter of 2021. Capacity pressure can shift for many reasons, but this kind of movement reinforces the need for sharper operational visibility. Contractors need to know not only whether work is happening, but whether crews are being deployed in ways that create reliable output and protect margins.
For many companies, labor analytics enters the conversation as a response to these constraints. It creates a framework for measuring the gap between planned labor performance and actual site conditions. Once that gap is visible, managers can improve crew allocation, identify bottlenecks, benchmark subcontractors, and forecast schedule risks before they become expensive surprises.
What labor analytics actually means
Labor analytics in construction is often misunderstood as a form of worker surveillance. That framing misses the point and often creates unnecessary resistance. In practice, the strongest use cases are less about monitoring individuals and more about understanding workflow, utilization, and the barriers that prevent productive work. The goal is to help crews perform better by improving how work is prepared, sequenced, staffed, and supported.
At its core, labor analytics combines field data, project controls, and operational context. It connects labor hours to activities, locations, outputs, cost codes, safety conditions, equipment use, and schedule milestones. Instead of asking only how many hours were spent on a task, it asks what those hours produced, what interrupted them, and whether the same pattern is happening elsewhere on the project or portfolio.
This distinction matters because higher labor hours do not automatically mean higher productivity. A crew can appear fully occupied while losing time to waiting, rework, travel, congestion, or poor material staging. Traditional reporting often captures hours without explaining the quality of those hours. Labor analytics helps translate effort into measurable insight.
The most useful analytics programs usually focus on a few operational dimensions first. These include crew utilization, productive versus unproductive time, absenteeism, output per labor hour, trade coordination, schedule variance, and labor cost performance by work package. Once these are measured consistently, firms can layer in predictive tools, benchmarking, and AI-based forecasting.
In other words, labor analytics is best understood as an intelligence layer. It does not replace superintendent judgment or field experience. It gives those decision makers better evidence. The strongest outcomes come when data and field expertise work together rather than competing with each other.
The technologies making labor analytics practical
One reason labor analytics is gaining traction now is that the technology stack has matured. A few years ago, many forms of jobsite measurement were expensive, intrusive, or difficult to scale. Today, connected platforms, mobile apps, wearables, and sensor-based systems are making field data easier to collect and easier to interpret. This lowers the barrier for firms that want more visibility without building a research lab.
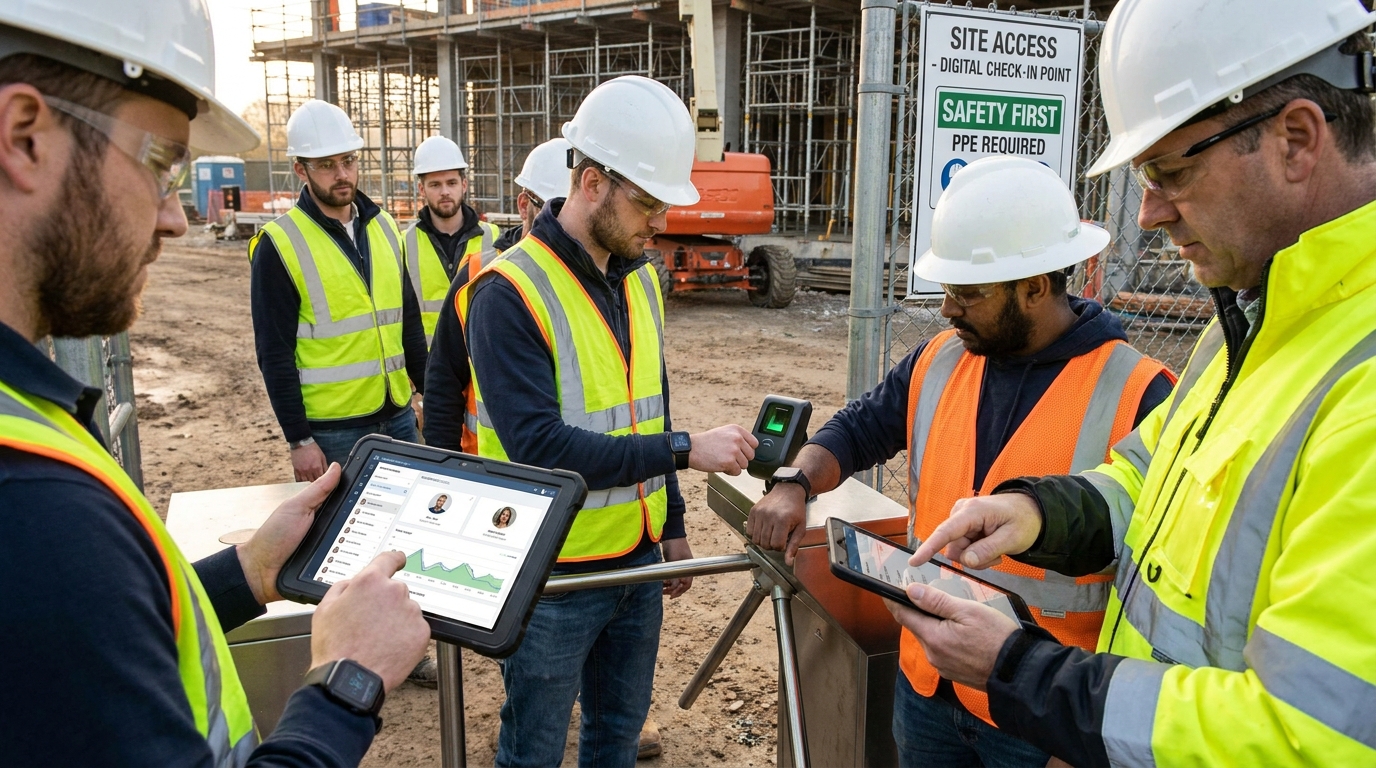
Digital time-and-attendance systems are often the entry point. They improve the quality of labor records by replacing paper logs and delayed reporting with real-time check-ins, geofenced presence data, and crew-level time coding. On their own, these systems are useful. Connected to cost codes, daily reports, and schedule data, they become much more powerful because they start to reveal where labor is being spent relative to planned work.
Wearables are another important development. Depending on the system, they can provide location awareness, fatigue indicators, movement patterns, heat stress alerts, or safety signals. While adoption varies by contractor and project type, the direction is clear: labor data is expanding from timekeeping into a broader understanding of how work conditions affect both productivity and worker well-being.
Computer vision is moving quickly as well. Cameras combined with machine learning can help identify work progress, detect unsafe conditions, and estimate activity patterns across zones of a site. This is especially valuable on complex projects where manual observation is inconsistent or too slow. Rather than relying entirely on anecdotal impressions, teams can review evidence of congestion, inactivity, material buildup, or sequencing conflicts.
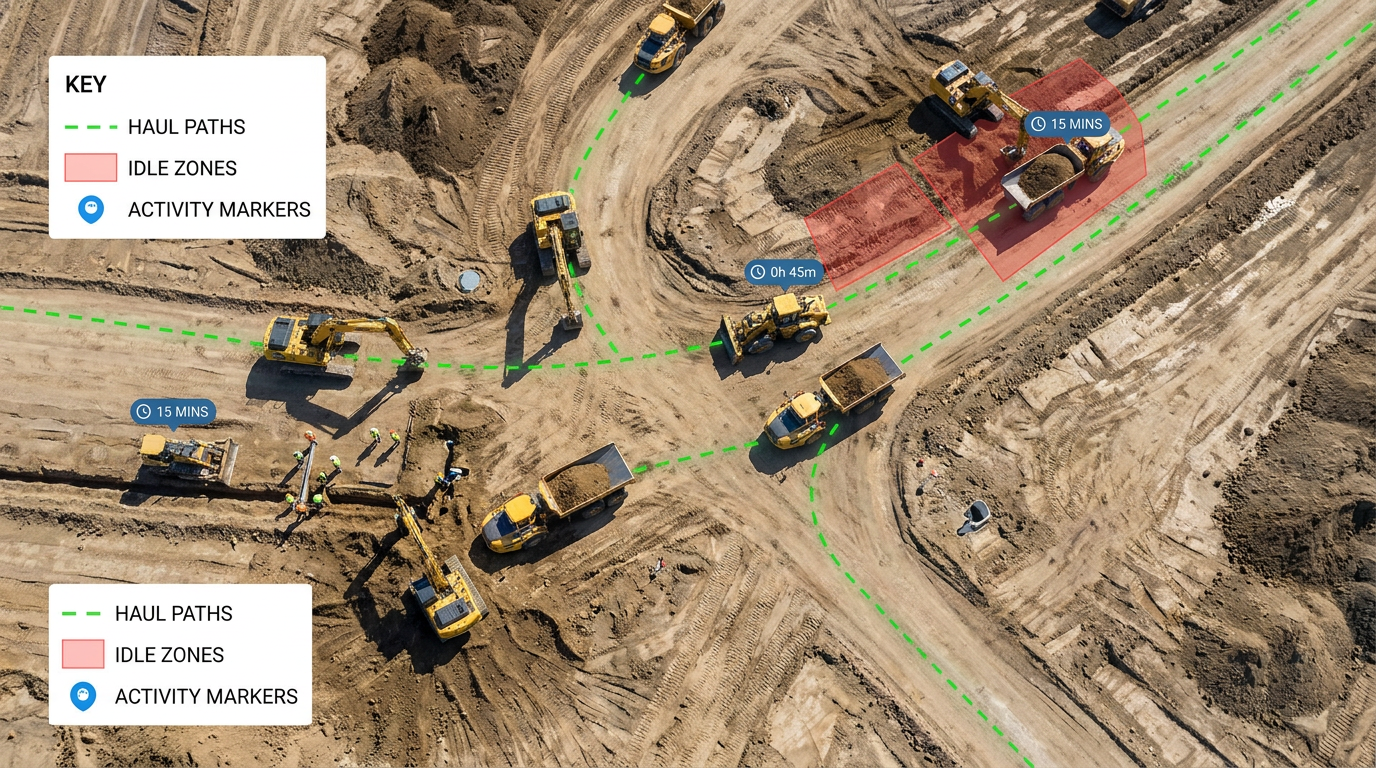
GPS and location data remain highly practical, especially in civil and earthwork environments. A Montreal earthwork case study showed that GPS-based measurement could capture actual site productivity, identify activity durations, and distinguish idle time without the need for costly dedicated sensors. That finding is important because it demonstrates a realistic pathway for contractors who want better labor measurement using tools already present in many site operations.
Academic research is also broadening the field. Studies on masonry, electrical installation, and safety analytics show that work sampling, IMU sensors, and machine-learning methods can automate productivity measurement in ways that were once too manual to sustain. What matters commercially is not whether every contractor adopts every tool. What matters is that the evidence base is growing, and the methods are becoming more feasible for mainstream use.
Where the value shows up first
When contractors adopt labor analytics, they often expect value to appear mainly in payroll control or reporting accuracy. Those benefits are real, but the bigger gains usually show up in operational decisions. The first breakthrough is often simply seeing the difference between planned labor effort and actual site conditions clearly enough to act on it.
One major area of value is crew allocation. Labor analytics helps project teams match skill mix, crew size, and deployment timing to the realities of the schedule. If one area of the project is consistently overstaffed while another is starved for labor, analytics makes the imbalance visible earlier. That improves throughput and reduces the cost of reactive staffing decisions.
Another area is idle time reduction. Idle time in construction is rarely just workers standing still. It may include waiting for equipment, materials, access, information, permits, predecessor trades, or inspection clearance. Once idle patterns are measured by activity or location, project leaders can address the root causes rather than blaming labor performance in general terms.
Subcontractor benchmarking is another valuable use case. Many projects depend on multiple specialty trades with different working methods, supervision quality, and reporting discipline. Labor analytics makes it easier to compare planned versus actual output, evaluate schedule reliability, and identify which subcontractors consistently hit productivity targets under comparable conditions. That supports better procurement decisions and tighter accountability.
Cost control improves when labor data is linked to cost codes and earned value logic. Instead of finding out late that labor overruns have accumulated, managers can see emerging variance by work package and investigate early. Some issues turn out to be labor related, but many are planning problems, design changes, or workflow failures. Analytics shortens the time between signal and response.
The value also extends to safety and retention. Newer models use sensor and language data to infer fatigue, stress, and sentiment patterns. While these systems should be implemented thoughtfully, they point to a broader future for labor analytics. Productive crews are not just busy crews. They are crews working in conditions that support focus, predictability, and trust.
Real-world applications changing how jobsites are managed
To understand why labor analytics matters, it helps to move from theory to application. On active jobsites, the best analytics programs are not abstract dashboards sitting far from the field. They are operational tools that shape daily planning, weekly reviews, and mid-project corrections. They influence how foremen assign work, how superintendents coordinate trades, and how project managers evaluate risk.
Activity-level productivity tracking
Traditional labor reporting often aggregates hours at too high a level to be useful. A daily total for concrete, framing, or earthwork may satisfy accounting needs, but it does not explain where performance was gained or lost. Activity-level measurement breaks labor data into more specific tasks, zones, and time blocks. This can reveal, for example, that a crew performs strongly during installation but loses substantial time on material retrieval or repositioning.
That level of detail helps managers intervene intelligently. Instead of assuming the answer is to add labor, they can improve laydown planning, revise access routes, or change the order of work. In a low-margin environment, these adjustments often produce more value than simply increasing headcount.
Delay prediction and schedule risk detection
Integrated jobsite platforms are making it easier to compare labor performance with schedule expectations continuously. If actual crew output begins to drift below the planned production rate, or if one trade repeatedly starts late because predecessors are unfinished, analytics can flag schedule risk well before a milestone is missed. This creates more room for resequencing, acceleration decisions, or resource reallocation.
The key here is integration. Labor data becomes much more actionable when it is connected to project schedules, inspection milestones, equipment availability, and even weather inputs. AI models are increasingly being used to detect patterns across those variables and forecast delay risk. That does not make project uncertainty disappear, but it does make it more measurable.
Earthwork and heavy civil optimization
Heavy civil projects offer some of the clearest examples of measurable labor analytics because movement, cycle times, and equipment interactions can be tracked with location data. The Montreal earthwork case study is a useful example. It demonstrated that GPS data could be used to measure actual site productivity and identify idle time without expensive dedicated sensors. For contractors, this is compelling because it shows that valuable insight can come from systems already embedded in operations.
When cycle inefficiencies are visible, field leaders can adjust haul routes, loading sequences, operator assignments, and equipment matching. Because labor and equipment performance are intertwined in earthwork, analytics creates a more realistic picture of total operational efficiency. It shows whether labor is constrained by effort, by process, or by machine coordination.
Trade performance in building projects
On vertical building projects, labor analytics is increasingly useful for trades such as masonry, electrical, drywall, and finishing. Academic studies show that sensor-based and machine-learning approaches can automate productivity measurement for tasks that used to require intensive manual observation. That opens the door to more consistent benchmarking across floors, zones, or crews.
For project teams, the practical benefit is comparability. If one crew consistently outperforms another under similar conditions, managers can study why. The explanation may involve supervision, sequence, tool access, material staging, crew composition, or training. Analytics helps isolate those differences so improvement becomes repeatable rather than anecdotal.
The real promise of labor analytics is not that it watches workers more closely. It helps contractors understand work more clearly.
Case study logic: what successful implementations have in common
Although every contractor starts from a different point, successful labor analytics programs tend to share a few characteristics. First, they begin with a specific operational question rather than a vague desire to be data-driven. A firm may want to reduce waiting time in concrete operations, improve labor forecasting on multifamily projects, or benchmark subcontractor performance across a portfolio. Clear questions produce useful metrics.
Second, successful programs focus on data quality before dashboard complexity. One of the most common misconceptions in construction technology is that better software automatically creates better insight. In reality, poor coding discipline, inconsistent field reporting, and weak process alignment can make sophisticated analytics misleading. The biggest gains often come from better data capture and better coordination rather than more automation alone.
Third, strong implementations treat labor analytics as a management system, not just a reporting system. That means the data is reviewed in regular planning routines, tied to accountable actions, and understood by both field and office teams. If labor insights stay trapped in monthly reports, they arrive too late to improve site execution. The firms seeing the best outcomes use the data in daily huddles, weekly work planning, and production reviews.
Fourth, successful adopters avoid presenting labor analytics as a tool for blame. Construction teams are more likely to engage with measurement when it is clearly tied to removing obstacles and supporting better work. If analytics only appears when management wants to explain a cost overrun, trust deteriorates quickly. If it is used to identify missing materials, poor sequencing, or repetitive rework, crews can see the value.
Finally, the best implementations combine quantitative data with field judgment. Numbers can show where the problem is concentrated, but experienced superintendents and foremen usually know why it is happening. Construction remains a dynamic environment shaped by design changes, weather, access constraints, and human coordination. Analytics performs best when it sharpens judgment rather than pretending to replace it.
Labor analytics and small-firm adoption in Canada
Because so much of Canadian residential construction employment sits in firms with fewer than 20 workers, small-firm adoption deserves special attention. It is easy to assume that labor analytics is mainly for large general contractors with enterprise software budgets. In reality, smaller firms may have just as much to gain, particularly when margins are tight and labor flexibility is limited.
For a smaller contractor, labor analytics does not need to begin with advanced AI or computer vision. A disciplined system for digital time capture, standardized cost coding, daily production tracking, and simple variance reviews can already create meaningful visibility. The objective is to build a reliable feedback loop between labor hours, work completed, and causes of disruption.
This matters because small firms often operate with less slack. If one crew is misallocated, one material issue causes downtime, or one phase experiences rework, the financial impact can be immediate. Better labor insight helps these firms protect profitability without overbuilding administrative overhead.
There is also a strategic dimension. As clients, lenders, and larger project partners demand better reporting and more predictable delivery, data maturity becomes a competitive advantage. Smaller contractors that can show consistent production measurement, schedule discipline, and workforce visibility may be better positioned to win work, collaborate with larger partners, and scale responsibly.
In that sense, labor analytics can support digital adoption in a very practical way. It gives small firms a measurable reason to modernize field processes. Instead of adopting technology for its own sake, they adopt it to solve labor allocation, productivity, and coordination problems that directly affect project performance.
How labor analytics supports leaner, smarter project delivery
Labor analytics fits naturally with lean construction principles because both focus on reducing waste and improving flow. If a project team wants smoother handoffs between trades, more reliable weekly work planning, and fewer disruptions in the field, labor data can help validate where waste is occurring. It brings evidence to conversations that might otherwise rely on intuition or frustration.
For example, if drywall crews repeatedly lose time because framing is not fully ready, that is not simply a drywall problem. It is a workflow problem. Labor analytics can show how much productive capacity is being lost to incomplete prerequisite work. That makes coordination failures visible in operational terms rather than subjective complaints.
The same logic applies to material management. On many projects, labor underperformance is actually a symptom of supply friction. Missing materials, incomplete kits, poor staging, or late deliveries can turn skilled labor into waiting labor. When labor analytics is interpreted alongside procurement and logistics data, project teams can trace cost and schedule pain back to the true source.
This is why the most mature construction intelligence strategies are becoming more integrated. Labor data is increasingly analyzed together with equipment telemetry, weather records, quality events, safety observations, and schedule status. The insight becomes richer because construction problems are rarely isolated. A delay in one system ripples into labor, cost, and sequencing across the project.
In practical terms, that means labor analytics is evolving from a narrow productivity metric into a broader management capability. It helps firms understand not just whether work is happening, but whether the system around the work is enabling crews to perform at their best.
Common misconceptions that hold firms back
Despite the momentum, a few misconceptions still slow adoption. The first is the belief that construction productivity is too messy to measure. It is true that sites are dynamic and conditions vary constantly. But that does not make measurement impossible. Work sampling, GPS, wearables, IMU sensors, mobile reporting, and machine-learning methods have all shown that construction activity can be measured with useful accuracy.
The second misconception is that labor analytics is mainly about surveillance. If implementation is poorly communicated, teams may understandably worry about that. But the highest-value use cases are usually focused on workflow, bottlenecks, and support conditions rather than policing individuals. Firms that frame analytics around removing obstacles tend to gain stronger buy-in.
A third misconception is that more software automatically means better decisions. In reality, disconnected tools can create more noise than insight. What matters is data quality, operational relevance, and process discipline. A simple, well-used system often outperforms a complex platform that nobody trusts or updates consistently.
Another common error is assuming labor analytics replaces field leadership. It does not. Superintendents, foremen, and project managers still interpret context, make trade-offs, and manage relationships. Analytics strengthens those decisions by making patterns visible sooner and more objectively.
Finally, some firms assume the business case is too weak unless they operate at large scale. Yet the industry’s current labor and productivity pressures suggest the opposite. When hiring is difficult and delays are expensive, even modest improvements in utilization, rework reduction, or schedule reliability can justify the effort quickly.
A practical roadmap for getting started
For contractors considering labor analytics, the best starting point is not to buy every new tool. It is to define one or two operational problems that consistently damage performance. These might include labor overruns in one trade, recurring waiting time between activities, weak subcontractor forecasting, or poor visibility into absenteeism and productivity by zone.
From there, firms can build a phased approach:
- Standardize field data capture. Use consistent cost codes, crew identifiers, and activity definitions so labor hours can be analyzed meaningfully.
- Digitize time and attendance. Replace delayed or incomplete manual records with real-time labor visibility.
- Connect labor to output. Measure what was completed, not only how many hours were spent.
- Review planned versus actual weekly. Create simple routines where field and office teams evaluate variance together.
- Add contextual signals. Layer in schedule milestones, equipment use, weather, safety observations, or location data.
- Expand to prediction. Once historical patterns are reliable, use AI and statistical models to forecast delay risk and staffing needs.
This roadmap works because it respects construction reality. Most firms do not fail because they lack advanced algorithms. They fail because the basics are inconsistent. Once the foundation is in place, analytics becomes more credible and more actionable.
It is also worth setting expectations correctly. Labor analytics rarely delivers a single dramatic reveal on day one. Its value builds through repetition. The more consistently a firm measures work, the more it can distinguish normal variation from preventable inefficiency. Over time, that creates better estimating, stronger forecasting, and more resilient project execution.
The future of construction efficiency is measurable
Construction has entered a period where workforce scarcity, productivity pressure, and digital expectations are converging. In that environment, labor analytics stands out because it addresses a central question: how can contractors get better outcomes from the labor capacity they already have? The answer is not simply to push crews harder. It is to understand the system around labor well enough to reduce friction, improve planning, and support consistent production.
The data already tells us why this matters. Canadian residential construction productivity has fallen sharply over the long term. Small firms still dominate large parts of the market. Labor shortages remain severe across North America, with 92% of firms in the AGC and NCCER survey reporting hiring difficulty and 45% tying shortages to project delays. These are not isolated challenges. They are structural signals.
What makes this moment different is that the tools to respond are becoming more accessible. GPS-based measurement, digital time systems, wearables, computer vision, connected jobsite platforms, and AI-driven forecasting are all pushing labor analytics into everyday construction management. The industry now has practical ways to measure productive time, idle time, workflow bottlenecks, and crew performance with far more precision than traditional reporting allowed.
The firms that benefit most will be those that treat labor analytics as a means of improving work, not merely tracking it. That means using data to make planning more realistic, coordination more reliable, and support conditions stronger. It means linking labor insight to safety, schedule, equipment, and supply chain performance. And it means recognizing that the best productivity gains often come from removing the obstacles that keep skilled people from doing their best work.
Labor analytics is not a luxury layer for advanced contractors. It is emerging as a practical response to one of construction’s oldest problems: too much uncertainty around how labor translates into output. As more firms close that gap, construction efficiency will become less about intuition alone and more about measurable, repeatable performance. That is where the real potential is being unlocked.


No Comment! Be the first one.